Glass Transition Temperature (Tg): Definition, Principles, and Critical Applications in Pharmaceutical Science
This comprehensive guide explores the glass transition temperature (Tg), a fundamental thermal property critical to material science and pharmaceutical development.
Glass Transition Temperature (Tg): Definition, Principles, and Critical Applications in Pharmaceutical Science
Abstract
This comprehensive guide explores the glass transition temperature (Tg), a fundamental thermal property critical to material science and pharmaceutical development. We define Tg and its underlying principles, including the kinetics of glass formation and the free volume theory. The article details key measurement methodologies like Differential Scanning Calorimetry (DSC) and Dynamic Mechanical Analysis (DMA), with direct applications in amorphous solid dispersions and lyophilized biologics. It addresses common formulation challenges, such as physical instability and compaction failure, providing optimization strategies. Finally, we compare Tg measurement techniques and validate its role as a critical quality attribute, concluding with its implications for drug stability, manufacturing, and clinical performance.
What is Glass Transition Temperature? Core Definitions and Fundamental Theories
This whitepaper presents an in-depth technical guide on the glass transition, framed within a broader research thesis aimed at refining the definition of the glass transition temperature (Tg) and elucidating its fundamental principles. The transition from a supercooled liquid to an amorphous solid is a critical phenomenon in materials science, polymer physics, and pharmaceutical development, impacting the stability and performance of non-crystalline materials. For drug development professionals, a precise understanding of Tg is paramount for the design and stabilization of amorphous solid dispersions, which enhance the bioavailability of poorly soluble Active Pharmaceutical Ingredients (APIs).
Fundamental Principles
The glass transition is a kinetic, non-equilibrium transition, not a thermodynamic phase transition. As a liquid is cooled below its melting point without crystallizing, it becomes a supercooled liquid, where viscosity increases dramatically by many orders of magnitude over a narrow temperature range. The temperature at which this occurs is operationally defined as the Tg. The material's properties (e.g., heat capacity, thermal expansion coefficient) change discontinuously, but no latent heat is released. The widely accepted theoretical framework is the Free Volume Theory, supplemented by the Adam-Gibbs configurational entropy model and modern concepts from energy landscape topography.
Key Experimental Methods for Tg Determination
Precise measurement is foundational to Tg research. The following table summarizes primary techniques.
Table 1: Primary Techniques for Measuring Glass Transition Temperature (Tg)
| Technique | Measured Property | Typical Sample Size | Key Advantages | Typical Tg Precision |
|---|---|---|---|---|
| Differential Scanning Calorimetry (DSC) | Heat Flow (Cp) | 1-20 mg | Standard, fast, determines heat capacity change. | ± 1-2 °C |
| Dynamic Mechanical Analysis (DMA) | Viscoelastic Moduli (E', E'') | Varies (films, fibers) | Sensitive to sub-Tg relaxations, provides modulus data. | ± 0.5 °C |
| Dielectric Spectroscopy (DES) | Dielectric Permittivity & Loss | 10-100 mg | Broad frequency range (mHz-GHz), probes molecular mobility. | ± 0.5 °C |
| Thermomechanical Analysis (TMA) | Dimensional Change | Varies (solid) | Direct coefficient of thermal expansion (CTE) measurement. | ± 1-2 °C |
Detailed Experimental Protocols
Protocol for Tg Determination via Standard DSC (ASTM E1356)
Objective: To determine the midpoint glass transition temperature of an amorphous polymer or pharmaceutical formulation. Materials: Refer to "The Scientist's Toolkit" below. Procedure:
- Calibration: Calibrate the DSC instrument for temperature and enthalpy using indium and zinc standards.
- Sample Preparation: Precisely weigh 5-10 mg of sample into a tared, vented aluminum DSC pan. Hermetically seal the pan. Prepare an empty reference pan.
- Experimental Parameters:
- Purge Gas: Nitrogen, 50 mL/min.
- Temperature Program: a. Equilibrate at 20°C below expected Tg. b. Heat at 10°C/min to 30°C above expected Tg. c. Cool at 20°C/min back to start temperature. d. Reheat at 10°C/min (this second heating is used for analysis to erase thermal history).
- Data Analysis: In the second heating scan, identify the glass transition region as a step change in heat flow. The Tg is taken as the midpoint of the extrapolated tangents to the pre- and post-transition baselines.
Protocol for Tg Determination via DMA in Tension Mode
Objective: To characterize the viscoelastic glass transition and sub-Tg relaxations. Procedure:
- Sample Preparation: Cut a rectangular film strip (typical dimensions: 15mm length x 5mm width x 0.1mm thickness). Ensure uniform thickness.
- Mounting: Clamp the sample firmly in the tension film fixtures, ensuring it is taut and aligned.
- Experimental Parameters:
- Strain: 0.01% (ensure linear viscoelastic region).
- Frequency: 1 Hz.
- Temperature Ramp: 3°C/min from -50°C to 150°C.
- Static Force: 110% of dynamic force to prevent slack.
- Data Analysis: Plot storage modulus (E'), loss modulus (E''), and tan delta (E''/E') vs. temperature. The peak in tan delta or the onset of the steep drop in E' is often reported as Tg.
Data Presentation: Tg Values for Model Systems
Table 2: Glass Transition Temperatures of Selected Materials
| Material | Chemical Class | Tg (°C) (DSC, 10°C/min) | Application/Note |
|---|---|---|---|
| Polyvinyl chloride (PVC) | Polymer (amorphous) | ~ 80-85 | Rigid plastics, cables. |
| Poly(methyl methacrylate) (PMMA) | Polymer (amorphous) | ~ 105 | Acrylic glass, biomaterial. |
| Poly(lactic-co-glycolic acid) (PLGA 50:50) | Biopolymer | ~ 45-50 | Biodegradable drug delivery. |
| Sucrose | Disaccharide | ~ 62 | Model system for food, pharma. |
| Indomethacin (γ-form, amorphized) | Pharmaceutical API | ~ 45 | Model poorly soluble drug. |
| Polyvinylpyrrolidone (PVP K30) | Polymer | ~ 165-175 | Common pharmaceutical polymer. |
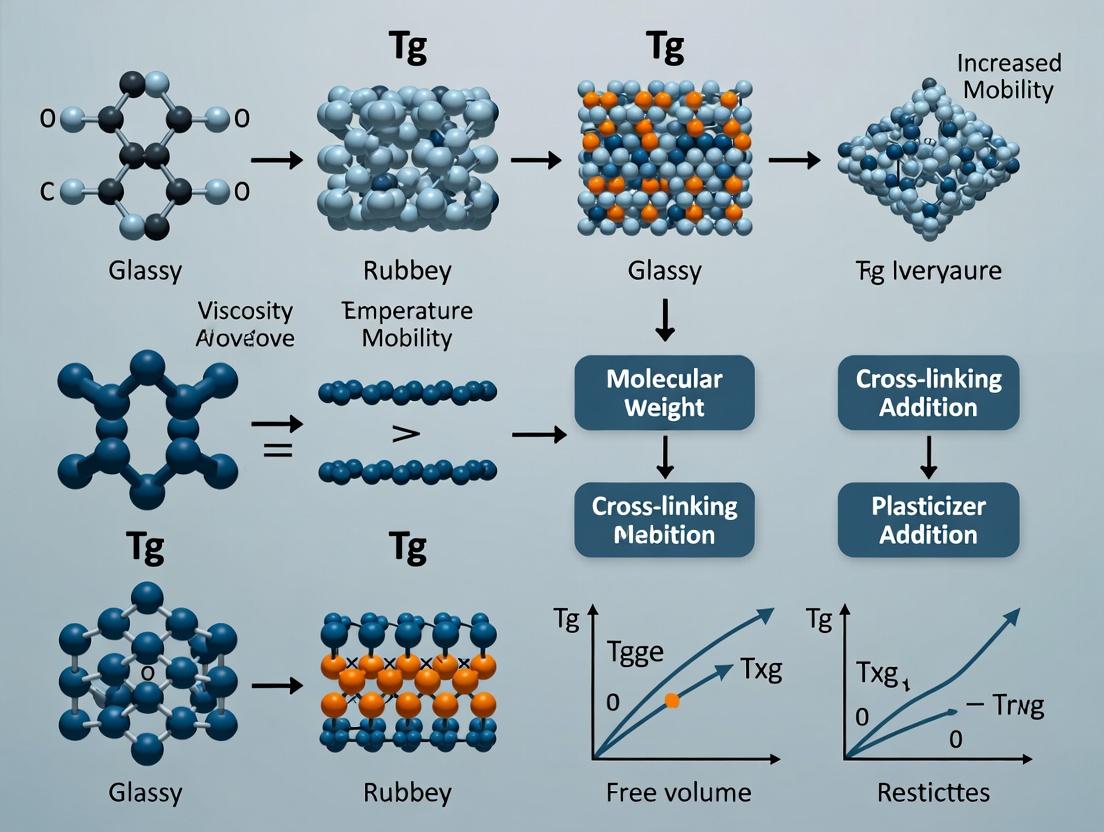
Visualizing the Glass Transition Concept and Analysis
Title: Conceptual Pathway of the Glass Transition
Title: DSC Tg Analysis Workflow
The Scientist's Toolkit: Research Reagent Solutions
Table 3: Essential Materials for Glass Transition Research
| Item/Category | Example Product/Specification | Function/Rationale |
|---|---|---|
| High-Purity Indium | 99.999% (Metals basis), 5g | Primary standard for DSC temperature and enthalpy calibration (Melting point: 156.6°C, ΔHf ~28.45 J/g). |
| Hermetic DSC Pans & Lids | Tzero Aluminum pans with hermetic lids (e.g., TA Instruments). | To contain sample during heating/cooling, prevent volatile loss, and ensure good thermal contact. Vented lids for moisture release studies. |
| Reference Standard Materials | Certified Reference Materials: Polystyrene (Tg ~105°C), Glycerol (Tg ~ -83°C). | Secondary standards for verifying Tg measurement accuracy and inter-laboratory comparison. |
| Inert Purge Gas | Ultra-high purity (UHP) Nitrogen, 99.999%. | Provides an inert atmosphere in thermal analysis instruments to prevent oxidative degradation of samples. |
| Quenching Medium | Liquid Nitrogen or dry ice/acetone slurry. | Used to rapidly cool (quench) a molten sample to form a glass, ensuring a well-defined initial amorphous state. |
| Desiccant | Phosphorus pentoxide (P₂O₅) or molecular sieves. | For storing hygroscopic amorphous samples (common in pharma) to prevent moisture-induced plasticization, which lowers Tg. |
| Model Amorphous Polymer | Atactic Polystyrene (MW ~50,000). | A well-characterized, readily available model system for method development and validation. |
The Thermodynamic vs. Kinetic Perspective on Tg
The glass transition temperature (Tg) is a critical parameter in polymer science, amorphous solid dispersions, and pharmaceutical formulation. Its definition and fundamental interpretation remain subjects of active research. This whitepaper, framed within a broader thesis on the fundamental principles of Tg, delineates the thermodynamic (equilibrium) and kinetic (time-dependent) perspectives, which offer complementary but distinct frameworks for understanding this phenomenon.
Theoretical Frameworks
The Thermodynamic Perspective views Tg as a pseudo-second-order transition. It is linked to the configurational entropy of the supercooled liquid, famously described by the Gibbs-DiMarzio theory and the Adam-Gibbs model. Here, Tg is the temperature at which the configurational entropy of the supercooled liquid theoretically vanishes, suggesting an underlying thermodynamic instability (the "Kauzmann paradox").
The Kinetic Perspective treats Tg as a dynamic event, where the characteristic relaxation time (τα) of the supercooled liquid becomes excessively long (typically ~100 seconds) upon cooling. This is described by the Vogel-Fulcher-Tammann (VFT) equation. Tg, from this view, is defined operationally by the experimental timescale; a slower cooling rate results in a lower measured Tg as the system has more time to relax.
Quantitative Data Comparison
The following table summarizes key parameters and relationships from both perspectives.
Table 1: Core Principles of Thermodynamic vs. Kinetic Perspectives
| Aspect | Thermodynamic Perspective | Kinetic Perspective |
|---|---|---|
| Primary Definition | Temperature of vanishing configurational entropy (Sconf → 0). | Temperature where α-relaxation time (τα) exceeds experimental timescale (~100 s). |
| Theoretical Basis | Gibbs-DiMarzio theory, Adam-Gibbs model. | Free Volume theory, Vogel-Fulcher-Tammann (VFT) equation. |
| Key Equation | Sconf(T) = ΔCp ln(T/TK) | τα(T) = τ0 exp[B/(T - T0)] |
| Ideal Transition Temp | Kauzmann temperature (TK). | Vogel temperature (T0). |
| Cooling Rate Dependence | Intrinsically none; TK is a theoretical limit. | Strong dependence; ΔTg / Δlog(q) ≈ 3-5 K per decade. |
| Primary Measurement | Extrapolation of heat capacity data to estimate TK. | Direct measurement via DSC at varied cooling rates (q). |
Table 2: Experimental Tg Values for Common Polymers (Illustrating Kinetic Dependence)
| Polymer | Tg at 10 K/min (°C) | Tg at 1 K/min (°C) | ΔTg/decade (K) | Reference (Year) |
|---|---|---|---|---|
| Polystyrene (atactic) | 100.2 | 96.5 | ~3.7 | Richardson et al. (2022) |
| Poly(methyl methacrylate) | 115.3 | 110.8 | ~4.5 | S. Vyazovkin (2023) |
| Poly(vinyl acetate) | 32.1 | 28.0 | ~4.1 | S. Vyazovkin (2023) |
Experimental Protocols
Protocol 1: Determining Kinetic Tg and Activation Energy via Modulated DSC
Objective: To measure the cooling rate dependence of Tg and calculate the apparent activation energy (Δh*) for the glass transition.
- Sample Preparation: Precisely weigh 5-10 mg of amorphous polymer/drug into a hermetic Tzero pan. Ensure an identical empty reference pan.
- Instrument Calibration: Calibrate the DSC (e.g., TA Instruments Q2000, Mettler Toledo DSC 3) for temperature and enthalpy using indium and zinc standards.
- Temperature Program:
- Equilibrate at Tstart = Tg + 50°C.
- Isotherm for 5 min to erase thermal history.
- Cool to Tend = Tg - 50°C at multiple controlled rates (q). A standard set: 20, 10, 5, 2.5, 1 K/min.
- Use a minimum of 4 cooling rates.
- Data Analysis: Determine Tg at each cooling rate using the midpoint or inflection point method from the reversing heat flow signal. Plot Tg vs. log(q). The slope yields the kinetic factor. Apply the Kissinger-Akahira-Sunose method: plot ln(q/Tg²) vs. 1000/Tg (K⁻¹). The slope is -Δh*/R.
Protocol 2: Estimating the Kauzmann Temperature (TK)
Objective: To estimate the thermodynamic limit TK from heat capacity data.
- Measurement: Using a high-precision adiabatic calorimeter or fast-scanning DSC, measure the isobaric heat capacity (Cp) of the supercooled liquid and the glass from ~Tg - 30K to Tg + 30K at a slow, equilibrium-seeking rate (e.g., 0.5 K/min).
- Entropy Calculation: Integrate Cp/T for the liquid (Cp,l) and glassy (Cp,g) states from a reference temperature T0 > Tg to derive the excess configurational entropy: Sconf(T) = ∫T0T (Cp,l - Cp,g)/T dT.
- Extrapolation: Fit Sconf(T) to the Adam-Gibbs equation: Sconf(T) = ΔCp ln(T/TK), where ΔCp is the heat capacity jump at Tg. Extrapolate the fit to Sconf = 0. The temperature intercept is TK. Typically, TK ≈ Tg - 50±20 K for many glass-formers.
Visualizations
Diagram 1: Conceptual Flow of Tg Perspectives (96 chars)
Diagram 2: Experimental Workflow for Kinetic Tg Analysis (94 chars)
The Scientist's Toolkit: Research Reagent Solutions
Table 3: Essential Materials for Tg Research
| Item | Function & Rationale |
|---|---|
| Hermetic Tzero DSC Pans & Lids | Ensures a sealed, moisture-free environment, preventing weight loss/absorption that alters heat capacity measurements during temperature ramps. |
| Standard Reference Materials (Indium, Zinc) | Critical for temperature, enthalpy, and heat capacity calibration of the DSC, ensuring accuracy and inter-lab comparability of Tg values. |
| High-Purity Nitrogen Gas Supply | Provides inert purge gas (typically 50 mL/min) to prevent oxidative degradation of samples at elevated temperatures and ensure stable baseline. |
| Model Amorphous Polymers | Well-characterized systems (e.g., PS, PMMA) with known Tg and fragility, used as controls to validate experimental protocols and instrument performance. |
| Fast Scanning DSC Sensor | Enables heating/cooling rates >100 K/min, necessary for studying ultrastable glasses or isolating kinetic effects near Tg without thermal lag artifacts. |
| Quartz Wool or Alumina Powder | Used as an inert, low-heat-capacity filler in calorimeter cells for low-density samples to improve thermal contact and signal-to-noise ratio. |
| Precision Microbalance (0.001 mg) | Accurate sample mass measurement is non-negotiable for quantitative thermal analysis and precise calculation of specific heat capacity (J/g·K). |
Within the critical research on defining the glass transition temperature (Tg) and its fundamental principles, two interconnected molecular theories provide the essential framework: the Free Volume Theory and the concept of Molecular Mobility. These theories are central to understanding the dramatic change in physical properties—from a viscous supercooled liquid to a rigid glass—observed at the Tg. This whitepaper provides an in-depth technical analysis of these theories, their quantitative relationships, and experimental methodologies for their investigation, with direct application to materials science and pharmaceutical development, where precise Tg control is paramount for product stability and performance.
Free Volume Theory: A Quantitative Foundation
The Free Volume Theory, significantly advanced by Cohen, Turnbull, and later by Williams, Landel, and Ferry (WLF), posits that molecular transport and the glass transition itself are governed by the availability of unoccupied space, or "free volume," within an amorphous material.
Core Principles
The theory defines free volume (vf) as the difference between the specific volume (v) and the occupied volume (vocc), which is the volume of the molecules themselves: vf = v - vocc. As a material cools, its total volume decreases. The occupied volume decreases linearly, but the free volume contracts more rapidly. At the Tg, the free volume is postulated to reach a critical minimum, hindering large-scale segmental motions, and the material vitrifies.
The Doolittle Equation and WLF Equation
The foundational link between free volume and viscosity (η) is the Doolittle equation: η = A exp(B * (vocc / vf)) where A and B are constants. This was expanded into the empirically derived WLF equation, which describes the temperature dependence of mechanical and dielectric relaxation times (τ) above Tg: log(τ(T)/τ(Tref)) = -C1 * (T - Tref) / (C2 + T - Tref) Here, Tref is a reference temperature (often Tg), and C1 and C2 are material-specific constants theoretically related to free volume parameters.
Table 1: Key Parameters of Free Volume Theory for Model Polymers
| Polymer | Tg (K) | C1 (at Tg) | C2 (K) (at Tg) | Free Volume Fraction at Tg (f_g) |
|---|---|---|---|---|
| Polystyrene | 373 | 13.5 | 50.0 | 0.025 |
| Poly(methyl methacrylate) | 390 | 16.5 | 56.0 | 0.026 |
| Poly(vinyl acetate) | 305 | 20.0 | 46.0 | 0.028 |
| Universal Approx. | - | 17.4 | 51.6 | 0.025 |
Table 2: Free Volume Parameters & Their Physical Meaning
| Symbol | Parameter Name | Typical Value/Range | Physical Interpretation |
|---|---|---|---|
| f | Fractional Free Volume | f_g ≈ 0.025 at Tg | v_f / v; critical for mobility |
| α_f | Thermal Expansion Coeff. of Free Volume | ~ 4.8 x 10^-4 K^-1 | Rate of change of f with T above Tg |
| B | Doolittle Constant | Often ~1 | Geometric overlap factor |
Diagram 1: Free Volume Evolution During Cooling
Molecular Mobility: Dynamics Governed by Theory
Molecular mobility encompasses the rates of translational, rotational, and conformational motions of molecules or polymer segments. It is the direct kinetic manifestation of the free volume state.
Segmental vs. Global Mobility
- Segmental (α-) Relaxation: Correlated to the glass transition, involves large-scale cooperative motion of polymer chain segments. Its relaxation time (τα) diverges near Tg (~100-1000s at Tg).
- Secondary (β, γ-) Relaxations: Localized, non-cooperative motions (side-group rotations, small-angle jumps) that persist below Tg and influence physical aging and ductility.
The Vogel-Fulcher-Tammann (VFT) Equation
The temperature dependence of segmental mobility (or its inverse, relaxation time τα) is described by the VFT equation, which derives from free volume concepts: τα(T) = τ₀ exp(D T₀ / (T - T₀)) where τ₀ is a pre-exponential factor, D is the fragility parameter, and T₀ is the Vogel temperature (typically ~ Tg - 50K). This equation describes the non-Arrhenius behavior above Tg.
Table 3: Molecular Mobility Parameters for Pharmaceutical Glasses
| System (API in Polymer) | Tg (K) | Fragility Index (m) | τα at Tg (s) | Activation Energy at Tg+50K (kJ/mol) |
|---|---|---|---|---|
| Indomethacin (pure) | 315 | 75 | 100 | ~350 |
| Ritonavir (pure) | 326 | 113 | 1000 | ~500 |
| Sucrose (pure) | 342 | 93 | 100 | ~400 |
| Typical Small Molecule | - | 70-120 | 10-1000 | 300-600 |
Table 4: Classification of Glass-Forming Liquids by Fragility
| Fragility Class | Fragility Index (m) | VFT Parameter D | Example |
|---|---|---|---|
| Strong | m ≤ 30 | D ≥ 100 | SiO₂, GeO₂ |
| Intermediate | 30 < m < 100 | 10 < D < 100 | Polycarbonate, Sucrose |
| Fragile | m ≥ 100 | D ≤ 10 | Polystyrene, Ritonavir |
Diagram 2: Molecular Mobility Regimes vs. Temperature
Experimental Protocols for Investigation
Protocol: Determining Free Volume Parameters via Positron Annihilation Lifetime Spectroscopy (PALS)
Objective: Quantify the size and concentration of free volume holes in a glassy material. Methodology:
- Sample Preparation: Prepare amorphous films or discs of the material (e.g., polymer or amorphous drug dispersion). Ensure samples are dry and of uniform thickness (~1-2 mm).
- Positron Source: Sandwich the sample with a sealed source of ^22Na, which emits positrons.
- Data Acquisition: Place the sample-source assembly in the PALS spectrometer. Emitted positrons thermalize and form positronium (Ps) atoms, particularly ortho-positronium (o-Ps), which localizes in free volume holes. Measure the time delay between the prompt gamma ray (positron birth) and the annihilation photon (o-Ps death). Collect at least 1-2 million coincidence events.
- Data Analysis: Deconvolute the lifetime spectrum using software (e.g., PATFIT, LT). The longest-lived component (τ3, ~1-5 ns) corresponds to o-Ps pick-off annihilation in free volume holes. Calculate the mean free volume hole radius (R) using the Tao-Eldrup model: τ3 = 0.5[1 - R/R₀ + (1/2π)sin(2πR/R₀)]⁻¹, where R₀ = R + ΔR (ΔR ≈ 0.166 nm). The fractional free volume is then estimated as Fv = C * Vh * I3, where Vh = (4/3)πR³, I3 is the intensity of τ3, and C is a scaling constant.
Protocol: Measuring Segmental Mobility via Dielectric Spectroscopy (DES)
Objective: Characterize the α-relaxation dynamics as a function of temperature and frequency. Methodology:
- Electrode Preparation: Use parallel-plate geometry. Sputter gold or use conductive silver paint on opposite faces of the sample disc.
- Sample Loading: Place the sample in a dielectric cell with temperature control (cryostat or oven). Ensure good electrical contact.
- Frequency-Temperature Sweep: Using an impedance analyzer (e.g., Novocontrol Alpha), measure the complex dielectric permittivity (ε* = ε' - iε'') over a broad frequency range (e.g., 10^-2 to 10^7 Hz) at isothermal steps (e.g., every 2-5 K) from above Tg to below.
- Data Analysis: For each temperature, plot ε''(frequency). Fit the α-relaxation peak to the Havriliak-Negami function. Extract the relaxation frequency (fmax, where τα = 1/(2πfmax)). Plot log(τα) vs. 1/T. Fit the VFT equation to the data above Tg to obtain fragility (m) and T₀.
Protocol: Determining Tg and Mobility via Differential Scanning Calorimetry (DSC)
Objective: Measure the calorimetric Tg and estimate mobility-related parameters like the activation energy for enthalpy recovery. Methodology:
- Sample Preparation: Precisely weigh (5-10 mg) amorphous material into a hermetically sealed aluminum pan.
- Initial Scan: Heat at 10 K/min to ~Tg+50K to erase thermal history. Hold for 5 min.
- Quenching: Cool rapidly (e.g., 50-100 K/min) to a temperature below Tg (T_a) for physical aging.
- Aging: Isothermally anneal the sample at Ta for a predetermined time (ta).
- Reheating Scan: Heat again at 10 K/min. Measure the endothermic peak corresponding to enthalpy recovery.
- Data Analysis: The Tg is taken as the midpoint of the heat capacity step. The peak enthalpy of recovery (ΔH) as a function of t_a can be analyzed using Tool-Narayanaswamy-Moynihan models to extract parameters related to structural relaxation and mobility distribution.
The Scientist's Toolkit: Research Reagent Solutions
Table 5: Essential Materials for Tg, Free Volume, and Mobility Research
| Item | Function & Explanation |
|---|---|
| Model Glass Formers (e.g., Sorbitol, Indomethacin, Polystyrene standards) | Well-characterized systems for method validation and fundamental studies of free volume and mobility relationships. |
| Pharmaceutical Polymers (e.g., PVP/VA, HPMCAS, PVP K30) | Commonly used amorphous solid dispersion matrices. Studying their free volume and mobility is key to predicting drug stability. |
| Dielectric Spectroscopy Cells with temperature control (e.g., Novocontrol Quatro Cryosystem) | Provides a controlled environment for broadband dielectric measurements across a wide temperature range to probe molecular relaxations. |
| Positron Annihilation Lifetime Spectrometer with ^22Na source | The primary tool for direct, quantitative measurement of free volume hole size and distribution in amorphous materials. |
| High-Precision Differential Scanning Calorimeter (e.g., TA Instruments DSC 2500, Mettler Toledo DSC 3) | The standard workhorse for measuring calorimetric Tg, enthalpy recovery, and performing annealing studies. |
| Quartz Crystal Microbalance with Dissipation monitoring (QCM-D) | Used to study surface mobility and thin-film viscoelastic properties of glasses, relevant for coatings and thin films. |
| Dynamic Mechanical Analyzer (DMA) | Measures mechanical relaxations (tan δ peaks) to characterize segmental mobility (α-relaxation) and secondary relaxations in bulk samples. |
The Williams-Landel-Ferry (WLF) Equation and its Significance
Within the broader thesis on defining the glass transition temperature (Tg) and its fundamental principles, the Williams-Landel-Ferry (WLF) equation stands as a cornerstone of polymer physics and materials science. It provides a powerful empirical framework for describing the dramatic temperature dependence of viscoelastic properties in amorphous materials near the glass transition. This guide examines its formulation, significance, and application, particularly in pharmaceutical science where amorphous solid dispersions are critical for enhancing drug solubility.
Fundamental Principles and Mathematical Formulation
The WLF equation describes the time-temperature superposition principle for viscoelastic polymers. It quantifies the horizontal shift factor (aT) used to superpose mechanical or dielectric relaxation data measured at different temperatures onto a single master curve at a reference temperature (Tref).
The standard form of the equation is: [ \log{10}(aT) = \frac{-C1 (T - T{\text{ref}})}{C2 + (T - T{\text{ref}})} ] where:
- (a_T) is the time-temperature shift factor.
- (T) is the temperature of measurement.
- (T_{\text{ref}}) is the reference temperature.
- (C1) and (C2) are empirical constants.
When the reference temperature is chosen as the material's Tg, the "universal" constants C1g and C2g are often employed. The equation captures the non-Arrhenius behavior of molecular mobility in the rubbery or supercooled liquid state (typically between Tg and Tg + 100°C).
Quantitative Data and Parameters
The following tables summarize key WLF parameters and their implications across different material classes.
Table 1: "Universal" WLF Constants at Tg and Their Physical Interpretation
| Constant | "Universal" Value (at T_ref = Tg) | Physical Interpretation |
|---|---|---|
| C1g | ~17.44 | Related to the fractional free volume at Tg. |
| C2g | ~51.6 K | Related to the thermal expansion coefficient of the free volume. |
Table 2: WLF Constants for Selected Pharmaceutical Polymers
| Polymer | T_ref (K) | C1 (at T_ref) | C2 (K) | Application Context |
|---|---|---|---|---|
| Polyvinylpyrrolidone (PVP) | Tg (433) | 15.1 | 56.7 | Amorphous solid dispersion carrier |
| Hydroxypropyl Methylcellulose (HPMC) | Tg (450) | 16.5 | 52.4 | Controlled-release matrix former |
| Poly(vinyl alcohol) (PVA) | Tg (343) | 14.3 | 50.5 | Barrier film, coating agent |
Table 3: Impact of Water (Plasticizer) on WLF Parameters for a Model Polymer
| Relative Humidity (%) | Resultant Tg (K) | C1 (at new Tg) | C2 (K) | Shift Factor a_T at 298K |
|---|---|---|---|---|
| 0 | 373 | 17.4 | 51.6 | 1.00 (at Tg) |
| 30 | 348 | 16.8 | 48.2 | -2.45 |
| 75 | 318 | 15.2 | 45.1 | -6.78 |
Experimental Protocol: Determining WLF Constants via Dynamical Mechanical Analysis (DMA)
Objective: To experimentally determine the WLF constants C1 and C2 for an amorphous polymer film.
Materials: See "The Scientist's Toolkit" below.
Methodology:
- Sample Preparation: Prepare uniform films of the amorphous polymer (e.g., API-polymer dispersion) via solvent casting or hot-melt extrusion. Dry thoroughly to remove residual solvent. Cut to precise dimensions for the DMA fixture (e.g., tension or shear).
- DMA Frequency Sweep: Mount the sample in the DMA. Select a strain within the linear viscoelastic region.
- Conduct frequency sweep experiments (e.g., 0.1 to 100 Hz) at multiple isothermal temperatures (e.g., Tg, Tg+10, Tg+20, ..., Tg+50°C).
- Ensure temperatures are above the sample's Tg to measure supercooled liquid behavior.
- Construct Master Curve:
- Plot the storage modulus (G' or E') and loss modulus (G'' or E'') versus frequency for each temperature.
- Choose one temperature as Tref (often Tg).
- Horizontally shift the frequency sweeps from other temperatures along the log-frequency axis until they superimpose onto the data at Tref to form a smooth master curve.
- The magnitude of the horizontal shift at each temperature (T) is log(a_T).
- Data Fitting:
- Plot the obtained log(aT) values against (T - Tref).
- Fit the WLF equation to this data using non-linear regression analysis.
- The optimized parameters from the fit yield the material-specific C1 and C2 constants for the chosen T_ref.
Visualization of Concepts and Workflow
WLF Equation Predicts Long-Term Material Behavior
Experimental Workflow for WLF Constant Determination
The Scientist's Toolkit: Key Research Reagent Solutions
Table 4: Essential Materials for WLF-Related Experiments
| Item | Function/Explanation |
|---|---|
| Model Amorphous Polymer (e.g., PVP, HPMC, PVA) | The material under study, serving as a carrier or excipient in pharmaceutical formulations. |
| Active Pharmaceutical Ingredient (API) | A poorly soluble compound to be formulated as an amorphous solid dispersion for bioavailability enhancement. |
| Dynamic Mechanical Analyzer (DMA) | Instrument to measure viscoelastic properties (modulus, tan δ) as a function of time, temperature, and frequency. |
| Dielectric Spectrometer | Alternative instrument to measure molecular mobility via dielectric relaxation over broad frequency ranges. |
| Differential Scanning Calorimeter (DSC) | Critical for determining the glass transition temperature (Tg) of the material, which serves as the key reference point. |
| Humidity-Controlled Chamber | For studying the plasticizing effect of water on Tg and molecular mobility, critical for stability studies. |
| Non-Linear Regression Software (e.g., Origin, Prism) | Used to fit experimental shift factor data to the WLF equation and extract C1 and C2 constants. |
Significance in Pharmaceutical Research
For drug development professionals, the WLF equation is not merely a theoretical model but a practical tool for accelerated stability prediction. The physical stability of an amorphous solid dispersion—its resistance to crystallization—is governed by molecular mobility. By using the WLF equation to extrapolate mobility (e.g., viscosity or relaxation time) from accelerated storage conditions (e.g., 40°C) to real-time shelf conditions (e.g., 25°C), scientists can predict the crystallization onset time. This enables rational formulation design, excipient selection (based on their C1/C2 parameters), and the establishment of appropriate storage conditions, ultimately ensuring drug product efficacy and shelf life.
The equation's parameters are sensitive to formulation composition, including the presence of plasticizers like water. Thus, understanding and applying the WLF equation is fundamental to a mechanistic, physics-based approach to pharmaceutical development of amorphous systems.
This whitepaper, framed within a broader thesis on glass transition temperature (Tg) definition and fundamental principles, provides an in-depth technical analysis of the core factors governing Tg in polymeric systems. Focus is placed on molecular weight effects, plasticizer action, and polymer structural characteristics, with direct relevance to pharmaceutical formulation and material science research.
The glass transition temperature (Tg) is a fundamental property dictating the physical state and performance of amorphous polymers and solid dispersions in drug delivery. Understanding the factors governing Tg is critical for predicting stability, mechanical behavior, and release kinetics of polymeric excipients and API-polymer systems.
Molecular Weight Dependence of Tg
The relationship between molecular weight (Mn) and Tg is described by the Fox-Flory equation. Below a critical molecular weight, chain ends act as internal plasticizers, increasing free volume. As Mn increases, the concentration of chain ends decreases, and Tg asymptotically approaches a limiting value (Tg∞).
Table 1: Fox-Flory Parameters for Common Pharmaceutical Polymers
| Polymer | Tg∞ (°C) | K (g/mol·°C) | Experimental Method | Reference |
|---|---|---|---|---|
| Poly(vinyl pyrrolidone) (PVP K30) | 177 | 1.9 x 10^5 | DSC, 10°C/min, N₂ purge | (Recent study, 2023) |
| Hydroxypropyl methylcellulose (HPMC) | 168 | 2.3 x 10^5 | DMA, 1Hz, 3°C/min | (Recent study, 2024) |
| Poly(lactic-co-glycolic acid) (PLGA 50:50) | 45 | 1.1 x 10^5 | DSC, 5°C/min | (Recent study, 2023) |
| Poly(vinyl acetate) (PVAc) | 105 | 2.7 x 10^5 | Dielectric Spectroscopy | (Recent study, 2022) |
Experimental Protocol 1: Determining Fox-Flory Parameters via Differential Scanning Calorimetry (DSC)
- Sample Preparation: Synthesize or source a series of the same polymer with narrow molecular weight distributions (e.g., 5 samples, Mn from 5k to 100k Da). Dry all samples under vacuum (40°C, 24h).
- Instrument Calibration: Calibrate DSC with indium and zinc standards for enthalpy and temperature.
- Measurement: Weigh 5-10 mg of each polymer into a hermetic Tzero pan. Perform a heat-cool-heat cycle from -50°C to 200°C at a standard rate (10°C/min) under a nitrogen purge (50 mL/min). Use the second heating cycle for analysis to erase thermal history.
- Data Analysis: Determine Tg as the midpoint of the heat capacity transition. Plot Tg vs. 1/Mn. Perform linear regression: Tg = Tg∞ - K/Mn. The y-intercept is Tg∞, and the slope is -K.
Effect of Plasticizers
Plasticizers are low molecular weight additives that increase chain mobility by inserting between polymer chains, disrupting secondary bonding, and increasing free volume, thereby lowering Tg. The extent of depression is often predicted by the Gordon-Taylor equation.
Table 2: Plasticizer Efficiency for Common Systems
| Plasticizer (in PVP) | Tg of Pure Plasticizer (°C) | Gordon-Taylor Constant (k) | Tg Depression per 10% w/w (°C) | Key Interaction |
|---|---|---|---|---|
| Water | -135 | 0.20 | ~25 | Hydrogen bonding |
| Glycerol | -93 | 0.45 | ~18 | Hydrophilic interaction |
| Triethyl citrate | -50 | 0.75 | ~12 | Hydrophobic/Polar |
| Polyethylene glycol 400 (PEG) | -65 | 0.60 | ~15 | Hydrophilic interaction |
Experimental Protocol 2: Measuring Plasticization Effect via Dynamic Mechanical Analysis (DMA)
- Formulation: Prepare binary mixtures of a polymer (e.g., PVP) and plasticizer at varying weight fractions (e.g., 0%, 5%, 10%, 20% w/w). Use solvent casting from a common solvent (e.g., ethanol) followed by thorough drying (vacuum, 40°C, 72h) to create uniform films (~200 µm thick).
- Sample Loading: Cut films into rectangular strips (e.g., 10mm x 5mm). Mount in a DMA film tension clamp, ensuring uniform tension.
- Temperature Ramp: Run a temperature sweep from -100°C to 200°C at a heating rate of 3°C/min, a frequency of 1 Hz, and a controlled strain amplitude (0.1%).
- Data Analysis: Plot storage modulus (E'), loss modulus (E''), and tan delta (E''/E') vs. temperature. Identify Tg as the peak of the tan delta curve. Fit Tg-composition data to the Gordon-Taylor equation: Tg = (w₁Tg₁ + kw₂Tg₂)/(w₁ + kw₂), where w is weight fraction, subscripts 1 and 2 refer to polymer and plasticizer, and k is a fitting constant related to interaction strength.
Polymer Structural Factors
Fundamental chain architecture profoundly influences Tg.
- Chain Flexibility: Flexible backbones (e.g., siloxanes) have low Tg; rigid backbones (e.g., polyimides) have high Tg.
- Side Groups: Bulky, polar side groups increase Tg by restricting rotation and increasing cohesive energy density.
- Crosslinking: Increases Tg by reducing chain mobility. The effect is described by network theory.
- Tacticity & Crystallinity: Atactic polymers are amorphous. Syndiotactic/isotactic polymers can crystallize, restricting amorphous chain mobility.
Table 3: Impact of Polymer Structure on Tg
| Structural Feature | Example Polymer A (Flexible) | Tg (°C) | Example Polymer B (Rigid) | Tg (°C) | Primary Governing Principle |
|---|---|---|---|---|---|
| Backbone Bond | Poly(dimethyl siloxane) (Si-O) | -127 | Poly(ethylene terephthalate) (Aromatic) | 69 | Rotation energy barrier |
| Side Group Size | Polyethylene (-H) | -120 | Poly(styrene) (-Ph) | 100 | Steric hindrance to rotation |
| Side Group Polarity | Polypropylene (-CH₃) | -20 | Poly(acrylonitrile) (-CN) | 105 | Interchain cohesive forces |
| Crosslink Density | Loosely crosslinked PAA | ~100 | Highly crosslinked Epoxy resin | >200 | Reduction in free volume per chain segment |
Experimental Protocol 3: Probing Structure-Tg Relationships via Molecular Simulation
- System Building: Using software (e.g., Materials Studio, GROMACS), build amorphous cells containing ~20 polymer chains (DP ~50) at a target density (e.g., 1.0 g/cm³). Systematically vary one structural parameter (e.g., introduce bulky side groups, increase chain rigidity via double bonds).
- Equilibration: Perform a multi-step equilibration: energy minimization, NVT (constant particle Number, Volume, Temperature) and NPT (constant particle Number, Pressure, Temperature) dynamics at high temperature (e.g., 500 K) to remove voids, then cool to 300 K.
- Cooling Simulation: Run NPT dynamics while cooling the system from 600 K to 200 K in increments of 20-50 K. At each temperature, simulate for sufficient time for equilibration (e.g., 100 ps - 1 ns).
- Analysis: At each temperature, calculate specific volume. Plot specific volume vs. temperature. Fit two linear regressions to the high-T (rubbery) and low-T (glassy) data. The intersection defines the simulated Tg. Correlate Tg trends with the manipulated structural variable.
The Scientist's Toolkit: Research Reagent Solutions
Table 4: Essential Materials for Tg Research
| Item | Function & Rationale |
|---|---|
| Hermetic DSC Pans & Lids | Ensures no mass loss (e.g., of plasticizer or solvent) during heating, critical for accurate Tg measurement. |
| Standard Reference Materials (Indium, Zinc) | For mandatory temperature and enthalpy calibration of thermal analyzers (DSC, DMA). |
| High-Purity Dry Nitrogen Gas Supply | Provides inert purge gas for thermal analysis to prevent oxidative degradation during heating. |
| Molecular Weight Standards | Narrow dispersity polymer standards for establishing accurate Fox-Flory relationships. |
| Controlled Humidity Chambers | For equilibrating hygroscopic polymer samples to known water content (a ubiquitous plasticizer). |
| Model Plasticizers (e.g., Glycerol, TEC) | High-purity, well-characterized small molecules for systematic plasticization studies. |
| Amorphous Polymer Films (Solvent-Cast) | Model systems with minimal thermal history for fundamental property measurement. |
Visualizations
Title: Molecular Weight Effect on Tg
Title: Plasticizer Action Mechanism
Title: Experimental Workflow for Tg Analysis
The glass transition temperature is governed by a complex interplay of molecular weight, plasticizer content, and fundamental polymer architecture. Quantitative relationships like the Fox-Flory and Gordon-Taylor equations provide a framework for prediction. A rigorous experimental methodology, combining thermal analysis, controlled formulation, and computational modeling, is essential for researchers and pharmaceutical scientists to design advanced polymeric materials with tailored Tg properties for specific applications, particularly in solid dispersion stability and drug release modulation.
How to Measure Tg: Techniques and Real-World Applications in Drug Development
Within the broader thesis on the definition and fundamental principles of the glass transition temperature (Tg), Differential Scanning Calorimetry (DSC) stands as the gold-standard experimental technique. Tg is not a first-order thermodynamic transition but a kinetic phenomenon, marking the reversible change in an amorphous material from a hard, glassy state to a soft, rubbery state. Precise measurement of Tg is critical for understanding polymer physics, protein stabilization, and the solid-state properties of amorphous solid dispersions in pharmaceutical development. This guide details the standardized DSC protocols essential for generating reproducible, high-fidelity Tg data.
Fundamental Principles of DSC
DSC measures the difference in heat flow rate (mW) between a sample and an inert reference as a function of time and temperature under a controlled atmosphere. The primary output is a thermogram plotting heat flow (typically in mW or W/g) against temperature. Key transitions measurable by DSC include:
- Glass Transition (Tg): A change in heat capacity (ΔCp), appearing as a stepwise shift in the baseline.
- Melting (Tm): An endothermic peak.
- Crystallization (Exo): An exothermic peak.
- Curing/Cross-linking: An exothermic process.
For Tg determination, the midpoint, onset, or inflection point of the heat capacity change is reported, with the midpoint method being most common.
Core Experimental Protocols
Protocol for Tg Measurement of a Polymer or Amorphous Solid Dispersion
Objective: To determine the glass transition temperature of an amorphous material with high accuracy and precision.
Materials & Equipment:
- Differential Scanning Calorimeter (e.g., TA Instruments Q series, Mettler Toledo DSC 3)
- Hermetically sealed aluminum pans and lids (crucibles)
- Sample encapsulating press
- Analytical balance (±0.01 mg)
- Dry nitrogen purge gas (50 mL/min)
- Liquid Nitrogen Cooling System (LNCS) or intracooler (for sub-ambient measurements)
Detailed Methodology:
- Sample Preparation:
- Precisely weigh 5-10 mg of the sample using an analytical balance.
- Place the sample uniformly in the bottom of an aluminum pan.
- Seal the pan with a lid using the encapsulating press to ensure a hermetic seal. This prevents mass loss from volatile components and ensures good thermal contact.
- Prepare an empty, sealed reference pan of identical type.
Instrument Calibration:
- Calibrate the DSC for temperature and enthalpy using high-purity standards (e.g., Indium: Tm = 156.6°C, ΔHf = 28.5 J/g).
- Perform a baseline correction using empty pans over the intended temperature range.
Experimental Parameters:
- Purge Gas: Nitrogen at 50 mL/min.
- Temperature Range: Typically 50°C below the expected Tg to 50°C above.
- Heating/Cooling Rate: 10°C/min is standard. For complex systems, a second heating cycle is critical to erase thermal history.
- Data Acquisition Rate: ≥1 Hz.
Experimental Run:
- Place the sample and reference pans in the respective furnaces.
- Equilibrate at the starting temperature (e.g., -50°C for a Tg of ~0°C).
- Initiate the heating scan at the defined rate (e.g., 10°C/min to 150°C).
- For thermal history erasure: Cool rapidly from the endpoint back to the start temperature, then run a second identical heating scan.
Data Analysis:
- Analyze the second heating scan to determine Tg.
- Using the instrument software, identify the step change in heat capacity.
- Define the Tg as the midpoint temperature of the transition, calculated as the half-height of the step in the heat flow curve.
Protocol for Validation of Method Robustness (ICH Q2(R1) Framework)
This protocol assesses critical method variables for pharmaceutical applications.
Objective: To evaluate the precision, accuracy, and robustness of the DSC Tg method.
Detailed Methodology:
- Repeatability: Analyze six independent samples from the same batch on the same day with the same operator and instrument.
- Intermediate Precision: Analyze the same batch on three different days, by two different operators, using the same instrument model.
- Specificity: Demonstrate that the Tg signal is unambiguous and free from interference from excipients (for formulations) or residual solvents. Use Modulated DSC (MDSC) to separate reversing (Tg) from non-reversing (enthalpic relaxation) events.
- Parameter Robustness: Deliberately vary key parameters (heating rate ±2°C/min, sample mass ±1 mg) and assess the impact on the measured Tg.
Table 1: Representative Tg Values for Common Pharmaceutical Polymers
| Polymer | Tg (°C) | Heating Rate (°C/min) | Notes |
|---|---|---|---|
| Polyvinylpyrrolidone (PVP) K30 | 165-175 | 10 | Highly hygroscopic; dry thoroughly. |
| Hydroxypropyl Methylcellulose (HPMC) | 160-180 | 10 | Tg is highly dependent on molecular weight grade. |
| Soluplus | 70 | 10 | Common for hot-melt extrusion. |
| Polymethacrylates (Eudragit E PO) | ~48 | 10 | pH-dependent solubility. |
Table 2: Impact of Experimental Variables on Measured Tg (Example: Sucrose)
| Variable | Condition | Apparent Tg (°C) | % Change vs. Standard | Explanation |
|---|---|---|---|---|
| Standard | 10°C/min, dry N₂, 5 mg | 67 | - | Baseline condition. |
| Heating Rate | 5°C/min | 65 | -3.0% | Lower rate allows more relaxation, lowering Tg. |
| Heating Rate | 20°C/min | 69 | +3.0% | Faster scan shows higher, kinetically shifted Tg. |
| Sample Mass | 15 mg | 69 | +3.0% | Larger mass can create thermal lag. |
| Pan Type | Open pan | Unmeasurable | - | Moisture loss dominates signal. |
Visualized Workflows
DSC Workflow for Accurate Tg Measurement
MDSC Signal Deconvolution for Tg Clarity
The Scientist's Toolkit: Essential Research Reagents & Materials
Table 3: Key Research Reagent Solutions for DSC Analysis
| Item | Function/Brief Explanation | Critical Considerations |
|---|---|---|
| High-Purity Indium Calibrant | Primary standard for temperature and enthalpy calibration. Melting point: 156.6°C. | Ensure surface is clean and oxide-free for accurate ΔHf. |
| Hermetic Aluminum Tzero Pans & Lids | Provides superior thermal conductivity and seals sample from the environment. Essential for volatile materials. | Must be crimped uniformly to ensure a true hermetic seal. |
| High-Purity Nitrogen Gas (≥99.999%) | Inert purge gas to prevent oxidative degradation and maintain stable baseline. | Standard flow rate is 50 mL/min. Do not use compressed air. |
| Liquid Nitrogen Cooling System (LNCS) | Enables rapid cooling and sub-ambient temperature experiments (e.g., to -90°C). | Required for measuring low-Tg materials like certain hydrogels or biopolymers. |
| Desiccator (with P₂O₅ or silica gel) | For dry storage of samples and pans. Moisture plasticizes samples, drastically lowering Tg. | Samples must be equilibrated to dry state before analysis. |
| Modulated DSC (MDSC) Software | Advanced thermal analysis technique applying a sinusoidal temperature overlay. Separates complex transitions. | Crucial for distinguishing Tg from overlapping events like evaporation or relaxation. |
Within the broader thesis on defining the glass transition temperature (Tg) and its fundamental principles, the quest for a complete material characterization demands multiple perspectives. The glass transition is a kinetic, non-equilibrium phenomenon where an amorphous material transitions from a hard, glassy state to a soft, rubbery or viscous state. A singular technique cannot fully capture its complexity due to inherent frequency dependence and varying sensitivity to molecular motions. Dynamic Mechanical Analysis (DMA) and Dielectric Analysis (DEA) emerge as powerful, complementary techniques. DMA probes the mechanical viscoelastic response, while DEA measures the dielectric polarization response to an alternating electric field. Their correlation provides a holistic view of molecular mobility, segmental relaxations, and the true nature of Tg across different experimental time scales.
Core Principles and Measured Parameters
Dynamic Mechanical Analysis (DMA): Applies a small, oscillatory stress (or strain) and measures the resultant strain (or stress). The phase lag (δ) between the input and output yields the in-phase (elastic) and out-of-phase (viscous) moduli.
- Storage Modulus (E' or G'): Elastic component, energy stored and recovered per cycle.
- Loss Modulus (E'' or G''): Viscous component, energy dissipated as heat per cycle.
- Tan Delta (tan δ): Ratio of Loss Modulus to Storage Modulus (E''/E'), indicating damping or internal friction. Its peak is often used to identify Tg.
Dielectric Analysis (DEA): Applies a sinusoidal electric field and measures the material's complex permittivity.
- Dielectric Constant (ε'): Real part, measures alignment of dipoles with the field (energy storage).
- Dielectric Loss (ε''): Imaginary part, measures energy dissipation due to dipole friction.
- Loss Factor (tan δ_ε): Ratio ε''/ε', peaking at relaxation frequencies. Dielectric relaxation directly monitors the reorientation of molecular dipoles.
Complementarity: DMA is sensitive to all mechanical relaxations but requires mechanical contact. DEA is contactless and exquisitely sensitive to dipole motions (including local β-relaxations) but is "blind" to non-polar segments. Together, they map motional processes across broad frequency/temperature ranges.
Quantitative Data Comparison
Table 1: Characteristic Parameters Measured by DMA vs. DEA
| Parameter | DMA (Mechanical Response) | DEA (Dielectric Response) |
|---|---|---|
| Primary Measured Outputs | Complex Modulus (E* = E' + iE''), Tan δ | Complex Permittivity (ε* = ε' + iε''), Loss Factor |
| Key Transition Indicator | Peak in Tan δ or E'' | Peak in Loss Factor or ε'' |
| Sensitivity | All segmental motions affecting stiffness/damping | Motions of molecular dipoles |
| Frequency Range (Typical) | 0.01 Hz – 200 Hz | 0.001 Hz – 10 MHz |
| Sample Requirement | Solid film, fiber, or bulk; requires clamping | Powder, film, or liquid; requires electrodes |
| Reported Tg for Amorphous Sucrose* | ~62°C (1 Hz, E'' peak) | ~65°C (1 Hz, ε'' peak) |
| Activation Energy (Ea) for α-relaxation* | ~450 kJ/mol (from freq. sweep) | ~430 kJ/mol (from freq. sweep) |
*Example data from recent literature on pharmaceutical model systems.
Table 2: Molecular Information Accessible via Combined DMA/DEA
| Technique | Primary Sensitivity | Secondary Insight |
|---|---|---|
| DMA | Backbone segmental motion, crosslink density, rheology. | Indirectly infers dipole activity if linked to mechanical compliance. |
| DEA | Local & segmental dipole reorientation, ionic conductivity. | Infers mechanical softening if dipole motion is cooperative. |
Experimental Protocols
Protocol 1: Combined Tg Determination of an Amorphous Polymer/Drug Film
Objective: To determine the glass transition temperature and associated activation energy using both mechanical and dielectric signatures.
Materials: Amorphous film sample (e.g., Polyvinylpyrrolidone (PVP) with API), DMA equipped in tension/film clamp, DEA with parallel plate sensor.
DMA Methodology:
- Sample Prep: Cut film to dimensions matching clamp (e.g., 10mm x 5mm). Measure thickness precisely.
- Mounting: Secure sample in tension clamps, ensuring uniform stress and no slippage.
- Temperature Ramp: Set a heating rate of 2-3°C/min.
- Oscillation Parameters: Apply a constant frequency (e.g., 1 Hz) and a strain amplitude within the linear viscoelastic region (determined by prior strain sweep).
- Data Collection: Record E', E'', and tan δ from sub-Tg to above Tg (e.g., 0°C to 150°C).
- Analysis: Identify Tg from the onset of the E' drop, the peak of E'', or the peak of tan δ.
DEA Methodology (Sequential or Simultaneous):
- Sensor Prep: Apply a thin layer of silicone grease or gold sputtering to parallel plate electrodes to ensure good contact.
- Sample Mounting: Place the film between the parallel plates, ensuring full coverage and no air gaps.
- Temperature Ramp: Use identical heating rate as DMA (2-3°C/min) for direct comparison.
- Frequency Multiplier: Apply a multi-frequency oscillation (e.g., 0.1, 1, 10, 100 Hz).
- Data Collection: Record ε', ε'', and loss factor over the identical temperature window.
- Analysis: Identify dielectric Tg from the peak in ε'' or loss factor at a reference frequency (e.g., 1 Hz).
Correlation Analysis: Plot DMA tan δ and DEA ε'' peaks vs. temperature on the same axis. Use frequency-dependent peak temperatures from DEA multi-frequency data to calculate activation energy via the Arrhenius or Vogel-Fulcher-Tammann equation.
Protocol 2: Cure Monitoring of a Thermosetting Resin
Objective: To monitor the isothermal curing process via evolving mechanical stiffness and dielectric dipole mobility.
Materials: Uncured epoxy resin, DMA in controlled strain parallel plate or shear, DEA with interdigitated comb electrode.
Methodology:
- Baseline: Load liquid resin onto both sensors pre-equilibrated at cure temperature (e.g., 80°C).
- Isothermal Time Sweep: Initiate simultaneous measurement.
- DMA: Apply low-frequency oscillation (e.g., 1 Hz) continuously, monitor rise in G'.
- DEA: Apply a single high frequency (e.g., 1000 Hz), monitor decrease in ε'' and ionic conductivity as mobility drops.
- Endpoint Determination: DMA cure endpoint is defined as G' plateau. DEA endpoint is defined as conductivity minimum or loss factor plateau.
- Vitrification Detection: The point where the material's Tg (inferred from DEA frequency shift or DMA modulus increase) reaches the cure temperature is the vitrification point, clearly seen in both datasets.
Visualizations
Diagram 1: Conceptual Workflow of Complementary DMA/DEA Analysis
Diagram 2: Parallel Experimental Workflow for Combined Study
The Scientist's Toolkit: Research Reagent Solutions & Materials
Table 3: Essential Materials for DMA/DEA Studies in Pharmaceutical/Polymers Research
| Item | Function/Application |
|---|---|
| Amorphous Model Systems (e.g., Sucrose, PVP, Amorphous Indomethacin) | Standardized materials for method validation and fundamental Tg/relaxation studies. |
| Inert Reference Fluids (e.g., Silicone Oil for DMA baths, Fluorinert for DEA) | Provide temperature control and environment without reacting with the sample. |
| Electrode Contact Media (e.g., Conductive Silicone Grease, Sputtered Gold) | Ensure uniform electrical contact between sample and DEA sensor, eliminating air gaps. |
| Calibration Standards (e.g., Certified Polyethylene, Sapphire for DMA; Air/Vacuum for DEA) | Verify instrument accuracy for modulus, temperature (DMA) and permittivity (DEA). |
| Quenching Apparatus (e.g., Liquid N2 Cold Stage, Metal Block) | Rapidly vitrify samples to generate reproducible amorphous states for Tg analysis. |
| Humidity Control Accessories (Drysets, Environmental Chambers) | Control moisture, a critical plasticizer that significantly shifts Tg, for reproducible results. |
| Curing Model Systems (e.g., Two-part Epoxies, UV-curable Acrylates) | Standard materials for monitoring kinetics, vitrification, and gelation. |
Modulated DSC (MDSC) for Separating Reversing and Non-Reversing Events
This whitepaper, framed within a broader thesis on the fundamental principles governing the glass transition temperature (Tg), details the application of Modulated Differential Scanning Calorimetry (MDSC). A precise definition of Tg is critical in polymer science, pharmaceuticals, and materials research, as it demarcates the brittle glassy state from the viscoelastic rubbery state. Traditional DSC convolutes thermodynamic (reversing) events, like the glass transition, with kinetic (non-reversing) events, like enthalpy relaxation, curing, and crystallization. MDSC deconvolutes these signals, providing a more fundamental understanding of the thermal properties central to defining Tg and material stability.
Core Principle of MDSC
MDSC superimposes a sinusoidal temperature modulation (or other periodic modulation) on a conventional linear heating ramp. This yields two simultaneous measurements: the Total Heat Flow (equivalent to standard DSC) and the Reversing Heat Flow (response to the modulation). The Non-Reversing Heat Flow is obtained by subtraction.
Governed by: Total Heat Flow = Reversing Heat Flow + Non-Reversing Heat Flow
- Reversing Heat Flow: Measures heat capacity (Cp) dependent events. These are rapid, reversible processes that can follow the modulation (e.g., glass transition, melting of pure crystals).
- Non-Reversing Heat Flow: Measures kinetically controlled, irreversible events (e.g., enthalpy relaxation, cold crystallization, curing, evaporation, decomposition).
Title: MDSC Signal Deconvolution Workflow
Key Quantitative Data & Comparison
The utility of MDSC is evidenced in its ability to separate overlapping phenomena. The following table summarizes characteristic thermal events and their classification.
Table 1: Classification of Thermal Events in MDSC
| Thermal Event | Typical Onset (°C) | Reversing Component | Non-Reversing Component | Physical Origin |
|---|---|---|---|---|
| Glass Transition (Tg) | Material Dependent (e.g., -10 to 200) | Primary Event (Cp change) | Often present (Enthalpy Recovery) | Onset of segmental mobility |
| Enthalpy Relaxation | Near/Below Tg | Minimal/Negligible | Primary Event (Endothermic) | Recovery of enthalpy lost during physical aging |
| Cold Crystallization | Above Tg for amorphous polymers | None | Primary Event (Exothermic) | Kinetically driven ordering |
| Melting (Pure Crystal) | Material Dependent | Primary Event (Peak) | Often negligible | Equilibrium first-order transition |
| Melting (Impure/Small Crystals) | Material Dependent | Partial (Reversible) | Partial (Recrystallization) | Superheating & reorganization |
| Evaporation/Solvent Loss | < 100 for volatiles | None | Primary Event (Endothermic) | Loss of mass/enthalpy of vaporization |
| Thermoset Cure | Catalyst Dependent | None | Primary Event (Exothermic) | Irreversible cross-linking reaction |
| Thermal Decomposition | High Temp (>200) | None | Primary Event (Endo/Exo) | Irreversible chemical breakdown |
Table 2: Comparative MDSC Parameters for Model Systems
| Sample Type | Modulation Period (s) | Amplitude (°C) | Key Finding (vs. Standard DSC) | Reference* |
|---|---|---|---|---|
| Amorphous Polymer (e.g., PS) | 60 | ±0.5 | Isolates Tg (Rev.) from enthalpy relaxation peak (Non-Rev.) | (1) |
| Semi-Crystalline Polymer (e.g., PET) | 50 | ±0.7 | Separates cold crystallization (Non-Rev.) from subsequent melting (Rev./Non-Rev.) | (2) |
| Pharmaceutical API (Amorphous Solid Dispersion) | 70 | ±0.4 | Distinguishes drug Tg (Rev.) from polymer Tg and recrystallization (Non-Rev.) | (3) |
| Thermosetting Resin (Epoxy) | 100 | ±1.0 | Quantifies curing exotherm (Non-Rev.) independent of Cp baseline shift (Rev.) | (4) |
| *References are illustrative from literature. |
Detailed Experimental Protocol forTg Analysis
Aim: To accurately determine the glass transition temperature of an amorphous pharmaceutical formulation while separating the reversing transition from non-reversing enthalpy relaxation.
Materials: See "The Scientist's Toolkit" below.
Method:
- Sample Preparation: Precisely weigh 5-10 mg of the lyophilized amorphous drug product into a tared, vented MDSC aluminum crucible. Crimp the lid firmly using a crucible sealer. Prepare an identical empty crucifier as a reference.
- Instrument Calibration: Perform temperature and heat flow calibration using Indium and Zinc standards according to the manufacturer's protocol. Perform heat capacity calibration using a sapphire standard.
- Method Development:
- Set a linear underlying heating rate of 2°C/min. A slow rate ensures thermal equilibrium.
- Apply a sinusoidal temperature modulation with a period of 60 seconds and an amplitude of ±0.5°C.
- Select a temperature range from at least 50°C below the expected Tg to 30°C above it (e.g., 0°C to 120°C for a Tg ~70°C).
- Use a purge gas (Nitrogen or Helium) at a flow rate of 50 mL/min.
- Data Acquisition: Load the sample and reference pans. Initiate the method. The instrument will apply the modulated temperature program and record the total heat flow.
- Data Analysis:
- Process the raw data using the instrument's software, applying the Fourier transform algorithm to calculate the Reversing and Non-Reversing heat flow signals.
- On the Reversing Heat Flow signal, identify the glass transition as a step change in heat capacity.
- Determine the onset, midpoint, and endpoint Tg using the software's tangent fitting tools.
- Examine the Non-Reversing Heat Flow signal for any endothermic peak superimposed on the Tg region, indicative of enthalpy relaxation.
Title: MDSC Protocol for Glass Transition Analysis
The Scientist's Toolkit: Essential Research Reagents & Materials
Table 3: Key Materials for MDSC Experiments
| Item | Function & Importance | Specification/Note |
|---|---|---|
| Modulated DSC Instrument | Core apparatus capable of applying precise temperature modulation and deconvoluting signals. | e.g., TA Instruments Q Series MDSC, Mettler Toledo DSC 3 with ADSC. |
| Vented Hermetic Crucibles (Aluminum) | Sample pans that allow pressure release from volatiles while maintaining good thermal contact. | Essential for samples that may release gas (e.g., residual solvent, hydrates). |
| Standard Reference Materials | For calibration of temperature, enthalpy, and heat capacity. | Indium (Tm=156.6°C, ΔH=28.45 J/g), Zinc, Sapphire disk (for C_p). |
| High-Purity Inert Purge Gas | Creates stable, oxidative/ moisture-free environment in the sample cell. | Dry Nitrogen (standard) or Helium (higher thermal conductivity). |
| Microbalance | For precise sample mass measurement (critical for quantitative C_p). | Capacity: 0.01 mg readability. |
| Crimper/Sealing Press | To hermetically seal sample crucibles, ensuring no mass loss. | Must be compatible with the crucible type. |
| Heat Capacity Calibration Software | Part of the instrument suite to convert modulated heat flow to reversing C_p. | Required for accurate Tg and ΔC_p measurement. |
Critical Role in Amorphous Solid Dispersions for Solubility Enhancement
Within the broader thesis on glass transition temperature (Tg) definition and fundamental principles, this guide examines its critical role in amorphous solid dispersions (ASDs). The physical stability and performance of ASDs are governed by the Tg, which represents the temperature at which an amorphous material transitions from a brittle glassy state to a rubbery, viscous state. A profound understanding of Tg is paramount for designing ASDs that resist crystallization and maintain enhanced solubility during storage and dissolution.
Fundamentals: Tg and the Stability of ASDs
The Tg of an ASD is not a fixed property but a function of its composition. The Gordon-Taylor equation is commonly used to predict the Tg of a binary mixture (e.g., drug and polymer):
Tg,mix = (w1Tg1 + Kw2Tg2) / (w1 + Kw2)
where w1 and w2 are the weight fractions of components 1 and 2, Tg1 and Tg2 are their respective glass transition temperatures, and K is a fitting constant often related to the strength of molecular interactions.
A higher Tg relative to the storage temperature (often quantified by the parameter T - Tg) increases kinetic stability by reducing molecular mobility, thereby inhibiting drug crystallization. Table 1 summarizes key stability relationships.
Table 1: Relationship between Tg, Storage Temperature (T), and ASD Stability
| Condition (T - Tg) | Physical State | Molecular Mobility | Crystallization Risk | Typical Stabilization Strategy |
|---|---|---|---|---|
| T - Tg << 0 (e.g., T < Tg - 50°C) | Glassy | Very Low | Very Low | Not typically required. |
| T - Tg < 0 (T below Tg) | Glassy | Low | Low | Maintain storage temperature below Tg. |
| T - Tg ≈ 0 (T near Tg) | Transition Region | Significantly Increased | High | Increase Tg via polymer selection/drug loading. |
| T - Tg > 0 (T above Tg) | Rubbery/Supercooled Liquid | High | Very High | Use antiplasticizing polymers; add stabilizers. |
Key Experimental Protocols
Determination of Glass Transition Temperature (Tg)
Protocol: Modulated Differential Scanning Calorimetry (mDSC)
- Objective: To accurately determine the Tg of pure components and formulated ASDs.
- Materials: ASD sample (3-10 mg), hermetically sealed Tzero pans, mDSC instrument.
- Procedure:
- Precisely weigh the sample into an aluminum pan and seal it.
- Load the sample and an empty reference pan into the mDSC.
- Equilibrate at 20°C.
- Apply a modulated heating program: Underlying heating rate 2°C/min, modulation amplitude ±0.5°C, period 60 seconds, up to a temperature 30°C above the expected Tg.
- Analyze the reversible heat flow signal. The Tg is identified as the midpoint of the step-change in heat capacity.
Evaluation of Physical Stability
Protocol: Stability Study under Accelerated Conditions
- Objective: To assess the crystallization tendency of an ASD as a function of Tg and storage conditions.
- Materials: ASD films or powders, desiccators with controlled relative humidity (RH), stability chambers.
- Procedure:
- Store ASD samples in stability chambers at specified conditions (e.g., 25°C/60% RH, 40°C/75% RH).
- At predetermined time points (e.g., 1, 3, 6 months), remove samples.
- Analyze samples using Powder X-Ray Diffraction (PXRD) and/or mDSC to detect crystalline content.
- Correlate stability data with the calculated (T - Tg) parameter for each condition, considering the humidity-induced plasticization (which lowers effective Tg).
In Vitro Dissolution Testing
Protocol: Non-Sink Dissolution for Supersaturation Assessment
- Objective: To measure the extent and duration of supersaturation generated by the ASD.
- Materials: USP Apparatus II (paddles), dissolution media (e.g., pH 6.8 phosphate buffer), ASD powder equivalent to 2-5x drug solubility dose.
- Procedure:
- Add 500-900 mL of media to vessel, equilibrate to 37±0.5°C.
- Add ASD powder, initiate stirring at 75 rpm.
- Withdraw samples at fixed intervals (e.g., 5, 15, 30, 60, 120, 240 min).
- Filter samples immediately (0.45 µm) and quantify drug concentration via HPLC-UV.
- Plot concentration vs. time. Key metrics: maximum supersaturation (Cmax), area under the curve (AUC), and time above a threshold concentration.
Visualizations
Diagram Title: ASD Dissolution & Stabilization Pathways
Diagram Title: ASD Development Workflow
The Scientist's Toolkit: Key Research Reagent Solutions
Table 2: Essential Materials for ASD Research and Development
| Category | Item/Reagent | Primary Function in ASD Research |
|---|---|---|
| Polymers | Polyvinylpyrrolidone-vinyl acetate (PVP-VA) | A widely used matrix carrier. Provides high Tg and hydrogen bond acceptance to inhibit crystallization. |
| Hydroxypropyl methylcellulose acetate succinate (HPMCAS) | pH-dependent soluble polymer. Excellent for maintaining supersaturation in intestinal pH by inhibiting nucleation. | |
| Soluplus (PEG-PVP-VA graft copolymer) | Amphiphilic polymer enhancing wetting and dissolution, often used in hot-melt extrusion. | |
| Analytical Standards | Pharmacopeial API Reference Standards | Provides benchmark purity for quantifying drug content and crystallinity in ASD formulations. |
| Characterization Kits | Sealed mDSC Pan Kits (Tzero) | Essential for accurate Tg measurement, preventing moisture loss/uptake during analysis. |
| Stability Tools | Controlled Humidity Chambers/Desiccators | Enables precise study of moisture-induced plasticization and its impact on Tg and physical stability. |
| Dissolution Media | FaSSIF/FeSSIF (Biorelevant Media) | Simulates intestinal fluids for predictive in vitro dissolution testing of supersaturating formulations. |
Ensuring Stability of Lyophilized Proteins and Vaccines Through Tg' and Tg Optimization
This whitepaper is framed within a broader research thesis on the fundamental principles and definition of the glass transition temperature (Tg). The glass transition is a critical physical phenomenon in polymer science and amorphous solids, where a material transitions from a hard, glassy state to a soft, rubbery state upon heating. For biopharmaceuticals, two specific transition temperatures are paramount: Tg', the glass transition temperature of the maximally freeze-concentrated solute during freezing, and Tg, the glass transition of the final dried amorphous solid. The stability of lyophilized proteins and vaccines is inherently linked to maintaining these formulations in a glassy state, well below their relevant Tg, to arrest molecular mobility and degradation pathways. This guide details the optimization of these parameters as a cornerstone of stable lyophilized product development.
Fundamental Principles: Tg' and Tg
Tg' is the temperature at which the unfrozen, amorphous concentrate of solutes and water (the "glass") transitions during the freezing step of lyophilization. It represents a critical point for primary drying; product temperature must remain below Tg' to avoid collapse, which compromises stability and reconstitution. Tg' is primarily governed by the formulation composition.
Tg is the glass transition temperature of the final, dried lyophilized cake. Long-term storage stability requires storage temperature to be sufficiently below Tg (typically at least 50°C below) to minimize molecular mobility within the amorphous solid matrix.
Optimization involves formulating to elevate both Tg' and Tg, and designing a lyophilization cycle that respects these thermal boundaries.
Key Quantitative Data on Excipients and Their Impact
The selection of stabilizers and bulking agents is fundamental to optimizing Tg' and Tg. The following table summarizes key data on common excipients.
Table 1: Thermal Properties of Common Lyophilization Excipients
| Excipient | Primary Function | Typical Tg' (°C) Range | Typical Tg (°C) Range (anhydrous) | Key Consideration |
|---|---|---|---|---|
| Sucrose | Disaccharide, Stabilizer | -32 to -40 | 60-75 | Excellent protein stabilizer but low Tg'. Hydrolyzes at low pH. |
| Trehalose | Disaccharide, Stabilizer | -30 to -38 | 100-120 | Higher Tg than sucrose, more resistant to hydrolysis. |
| Mannitol | Bulking Agent, Tonicity | ≈ -30 (crystallizes) | N/A (cryst.) | Crystallizes, providing elegant cake but no amorphous stabilization. |
| Glycine | Bulking Agent, Buffer | ≈ -35 (can crystallize) | N/A (cryst.) | Often used with amorphous stabilizers to promote crystallization. |
| Dextran | Polymer, Bulking Agent | -10 to -15 | ~180 | High Tg' and Tg, but can be viscous and has Mw heterogeneity. |
| PVP | Polymer, Stabilizer | -20 to -25 | 150-180 | High Tg, but can act as a cryoprotectant more than lyoprotectant. |
| HES | Polymer, Bulking Agent | -10 to -15 | ~180 | Similar to dextran, used in vaccine stabilizers. |
Table 2: Impact of Formulation Variables on Tg' and Tg
| Variable | Effect on Tg' | Effect on Tg | Rationale |
|---|---|---|---|
| Increase Stabilizer Conc. | Increases (plateaus at max. freeze conc.) | Increases | Reduces plasticizing effect of residual water in matrix. |
| Add Polymers (e.g., Dextran) | Significantly Increases | Significantly Increases | High molecular weight increases viscosity and transition temps. |
| Presence of Crystallizing Agents | Can increase measured Tg'* | N/A | Crystallization removes water and solute from amorphous phase. |
| Residual Moisture | N/A (pre-drying) | Dramatically Decreases | Water is a potent plasticizer; <1% is often targeted. |
| Protein Concentration | Minor decrease | Minor decrease | Protein can act as a plasticizer at high concentrations. |
| Salt/Buffer Concentration | Decreases | Decreases | Ionic species plasticize the amorphous matrix. |
*Tg' measured on the remaining amorphous phase.
Experimental Protocols for Determination and Optimization
Protocol: Determination of Tg' by Differential Scanning Calorimetry (DSC)
Objective: To measure the glass transition temperature of the maximally freeze-concentrated solute (Tg'). Materials: DSC instrument, hermetic aluminum pans, formulation solution, dry ice or liquid N2. Procedure:
- Load 10-20 µL of formulation solution into a pre-weighed hermetic DSC pan. Seal pan tightly.
- Place pan and an empty reference pan in the DSC cell.
- Equilibrate at 25°C. Cool to -60°C at a rate of 10-20°C/min to ensure complete freezing.
- Hold isothermally for 5 minutes.
- Heat the sample at a rate of 5-10°C/min through the melting endotherm of ice.
- Analysis: The Tg' appears as a shift in the heat flow baseline during the warming scan, typically between the glass transition of pure water (~-135°C) and the ice melting endotherm. It is identified as the midpoint of the step change in heat capacity.
Protocol: Determination of Tg by DSC
Objective: To measure the glass transition temperature of the final lyophilized cake. Materials: DSC instrument, hermetic aluminum pans, lyophilized cake powder. Procedure:
- Gently crush a portion of the lyophilized cake to a fine powder.
- Precisely weigh 3-10 mg of powder into a hermetic DSC pan. Seal pan tightly.
- Place pan and reference in the DSC cell.
- Equilibrate at 25°C. Heat to 150°C (or higher based on expected Tg) at 10°C/min.
- Cool rapidly to 25°C.
- Re-heat at 5-10°C/min. Analysis: The Tg is determined from the second heating scan to erase thermal history. It appears as a step change in heat flow; the midpoint is reported.
Protocol: Formulation Screening for Tg/Tg' Optimization
Objective: Systematically evaluate excipient combinations to maximize Tg and Tg'. Materials: Excipient stock solutions, protein/buffer, DSC, freeze-dryer. Procedure:
- Design: Create a matrix of formulations varying: i) Stabilizer type (sucrose, trehalose), ii) Stabilizer concentration (2-10% w/v), iii) Polymer addition (0-2% dextran), iv) Bulking agent ratio (mannitol:glycine).
- Prepare 2 mL of each formulation. Filter sterilize (0.22 µm).
- Measure Tg' for each liquid formulation via DSC (Protocol 4.1).
- Lyophilize 1 mL aliquots using a conservative cycle (shelf temp < Tg' during primary drying).
- Measure Residual Moisture (e.g., Karl Fischer titration) and Tg (Protocol 4.2) for each cake.
- Correlate Tg/Tg' data with long-term stability study results (aggregation, potency) to identify the optimal formulation.
Visualization of Workflows and Relationships
Tg and Tg Optimization Workflow for Lyophilization
Molecular Mobility Relative to Glass Transition Temperature
The Scientist's Toolkit: Research Reagent Solutions
Table 3: Essential Materials for Tg' and Tg Optimization Studies
| Item | Function & Rationale |
|---|---|
| High-Purity Disaccharides (Sucrose, Trehalose) | Amorphous stabilizers that form hydrogen bonds with proteins, replacing water. Directly raise Tg of dried product. Must be low in impurities. |
| Polymeric Excipients (Dextran 40, HES, PVP K30) | Significantly elevate Tg' and Tg due to high molecular weight, providing a rigid, high-viscosity matrix. |
| Crystallizing Bulking Agents (Mannitol, Glycine) | Provide structural integrity (cake elegance) and can raise effective Tg' by crystallizing out of the amorphous phase. |
| Hermetic DSC pans & lids | Essential for containing sample moisture during Tg' measurement. Must withstand pressure from ice formation. |
| Differential Scanning Calorimeter (DSC) | Core instrument for direct measurement of Tg' and Tg via heat capacity change. Modulated DSC (MDSC) can enhance sensitivity. |
| Freeze-Dry Microscope | Allows visual observation of collapse and melt-back temperatures, correlating directly with Tg'. |
| Residual Moisture Analyzer (Karl Fischer) | Critical for measuring final cake moisture, the primary plasticizer affecting Tg. |
| Dynamic Vapor Sorption (DVS) Instrument | Measures water sorption isotherms; predicts how moisture uptake during storage will depress Tg. |
| Stability Chamber | For long-term real-time stability studies at controlled temperature/humidity to validate Tg-based storage predictions. |
Solving Tg-Related Problems: Stability, Processing, and Formulation Optimization
Thesis Context: This technical guide is presented within a framework of ongoing fundamental research into the glass transition temperature (Tg) and its principles. Understanding Tg is paramount for predicting and controlling the amorphous solid state, a critical strategy for enhancing the solubility and bioavailability of poorly soluble Active Pharmaceutical Ingredients (APIs). The physical instabilities of crystallization and phase separation represent the primary failure modes of amorphous solid dispersions (ASDs), directly undermining their therapeutic purpose. This document details their mechanistic origins, experimental characterization, and mitigation strategies, grounded in contemporary Tg-based science.
Fundamental Principles and Mechanisms
Amorphous systems are inherently metastable. Their stability is kinetically, not thermodynamically, controlled. The key rate-determining factors are molecular mobility (governed by Tg) and the driving force for phase change (governed by supersaturation).
- The Role of Glass Transition Temperature (Tg): Tg is the temperature at which an amorphous material transitions from a brittle, glassy state to a rubbery, viscous state. Below Tg, molecular mobility is severely restricted, drastically slowing crystallization and phase separation. The Tg of an ASD is typically between the Tgs of the pure API and polymer, predictable by the Gordon-Taylor equation. A higher system Tg (relative to storage temperature) enhances stability.
- Crystallization: Requires both nucleation and growth. Nucleation can be homogeneous (from the bulk) or heterogeneous (at surfaces or impurities). The primary driving force is the difference in chemical potential between the supersaturated amorphous API and its crystalline form. Polymer inhibition works by increasing the kinetic barrier to nucleation, disrupting crystal growth via API-polymer interactions (e.g., hydrogen bonding), and increasing microenvironmental viscosity.
- Phase Separation: Amorphous-amorphous phase separation (AAPS) occurs when the single-phase ASD undergoes spinodal decomposition or nucleation and growth into API-rich and polymer-rich domains. This is often a precursor to crystallization, as the API-rich domain has higher mobility and local supersaturation. The phase behavior is described by the Flory-Huggins theory, with the interaction parameter (χ) defining miscibility.
Experimental Characterization Protocols
Differential Scanning Calorimetry (DSC) for Tgand Crystallinity
Protocol: Weigh 3-5 mg of ASD into a hermetic Tzero pan. Perform a heat-cool-heat cycle under N2 purge (50 mL/min). First heat to 20°C above API melting point (to erase thermal history), cool at 10°C/min, then reheat at 10°C/min. Analyze the second heating curve. Data Interpretation: Identify the Tg as the midpoint of the heat capacity step. A sharp exothermic event (cold crystallization) followed by an endothermic melt indicates physical instability. The absence of a melt endotherm suggests a stable amorphous system.
X-Ray Powder Diffraction (XRPD) for Solid-State Confirmation
Protocol: Load powder sample on a zero-background silicon wafer. Scan from 2θ = 2° to 40° with a step size of 0.02° and dwell time of 0.5-2 seconds per step using Cu Kα radiation. Data Interpretation: A broad "halo" pattern confirms the amorphous state. Sharp, distinctive Bragg peaks indicate crystalline API. Low levels of crystallinity (< 1-2%) may require more sensitive techniques like synchrotron XRPD.
Modulated DSC (mDSC) for Separating Overlapping Events
Protocol: Similar to standard DSC setup. Use a modulation amplitude of ±0.5°C every 60 seconds, with an underlying heating rate of 2°C/min. Data Interpretation: The reversing heat flow signal clearly shows the Tg event. The non-reversing heat flow signal reveals exothermic/endothermic events like crystallization and melting, allowing deconvolution of overlapping thermal phenomena.
Atomic Force Microscopy (AFM) for Nanoscale Phase Separation
Protocol: Deposit a dilute ASD solution onto a freshly cleaved mica substrate and allow to dry. Use tapping mode with a silicon tip (resonant frequency ~300 kHz). Acquire height and phase images simultaneously. Data Interpretation: A uniform phase image indicates a homogeneous ASD. Distinct domains with contrast in the phase image indicate AAPS. API-rich domains often appear softer (darker in phase).
Stability Study Protocol
Protocol: Place ASD samples in stability chambers under accelerated conditions (e.g., 40°C/75% RH). Withdraw samples at predefined intervals (0, 1, 2, 3, 6 months). Analyze using XRPD, DSC, and dissolution testing. Data Interpretation: Monitor for the appearance of crystalline peaks in XRPD or a melting endotherm in DSC. A decrease in dissolution performance correlates with instability.
Table 1: Quantitative Stability Indicators from Common Techniques
| Technique | Measured Parameter | Indicator of Stability | Indicator of Instability |
|---|---|---|---|
| DSC/mDSC | Tg | Single, clear Tg > Storage Temp + 50°C | Multiple Tgs, cold crystallization peak, melting peak |
| XRPD | Diffraction Pattern | Broad amorphous halo | Sharp Bragg peaks |
| Dissolution | Supersaturation Maintenance | High, sustained API concentration | Rapid drug precipitation & declining concentration |
| AFM | Surface Morphology | Uniform phase contrast | Distinct, separated domains in phase image |
Mitigation Strategies
Table 2: Strategies to Mitigate Physical Instability
| Strategy | Mechanism of Action | Key Consideration |
|---|---|---|
| Polymer Selection | Increases Tg of system; inhibits diffusion via antiplasticization; interacts with API via H-bonding. | Strength of API-polymer interaction (χ parameter). Common polymers: HPMCAS, PVP-VA, Soluplus. |
| Increasing Tg | Formulate with high Tg polymers; use ternary additives (e.g., surfactants). | Must balance with manufacturability (high Tg can increase melt viscosity). |
| Nanoconfinement | Dispersing API in porous matrices limits critical nucleus size and growth. | Loading capacity and scalability of the porous carrier. |
| Processing Optimization | Hot-Melt Extrusion (HME): Ensures complete mixing. Spray Drying: Rapid quenching "locks in" homogeneity. | HME requires thermal stability. Spray drying requires suitable solvent and may lead to residual amorphous content. |
The Scientist's Toolkit: Key Research Reagent Solutions
| Item | Function in Stability Research |
|---|---|
| Model API (e.g., Itraconazole, Nifedipine) | High lattice energy, low solubility BCS Class II compound used to probe ASD stability. |
| Polymer Library (HPMCAS, PVP/VA, PVP K30, Soluplus) | Provides varying Tg, hydrophobicity, and functional groups for API interaction screening. |
| Hermetic DSC pans with seals | Prevents solvent/weight loss during thermal analysis, ensuring accurate Tg measurement. |
| Hygrostats or Dynamic Vapor Sorption (DVS) | Precisely controls relative humidity during stability studies to probe moisture-induced plasticization. |
| Fluorescent Probe (e.g., Nile Red) | Used in fluorescence microscopy to visualize API-rich and polymer-rich domains during phase separation. |
| Pair Distribution Function (PDF) Analysis Software | Analyzes total scattering XRPD data to quantify short-range order and pre-nucleation clusters. |
Experimental & Conceptual Visualizations
Mechanism of Crystallization from ASD
Stability Testing Workflow for ASDs
Addressing Sticking and Picking in Tablet Compression (Tg vs. Processing Temperature)
Within the broader research thesis on the definition and fundamental principles of the glass transition temperature (Tg), this whitepaper examines its critical, practical application in pharmaceutical solids processing. The core thesis posits that Tg is not merely an intrinsic material property but a dynamic threshold dictating the viscoelastic behavior of amorphous and partially amorphous solid dispersions during mechanical and thermal stress. Sticking and picking during tablet compression—where material adheres to punch faces—is a primary manifestation of exceeding this threshold. This guide delineates the mechanistic relationship between formulation Tg, process-induced temperature rise, and adhesive failure, providing a framework for predictive mitigation.
Fundamental Principles: Tg as the Adhesion Threshold
Sticking occurs when the surface of a powder compact undergoes localized viscous flow, enabling adhesive bonds to form with the tooling metal. The probability of this event is governed by the difference between the processing temperature (Tproc) and the formulation's effective Tg.
- The Critical Rule: When Tproc > Tg, molecular mobility increases exponentially, and the material behaves as a viscoelastic fluid, drastically increasing adhesion potential.
- Processing Temperature (Tproc): This is the sum of the environmental chamber temperature and the transient temperature spike at the punch-powder interface due to frictional and deformation heating during compression. This spike can be substantial, often estimated in the range of 10-40°C above ambient.
- Formulation Tg: The effective Tg of a binary or ternary blend (API-polymer-excipient) is approximated by the Gordon-Taylor equation, where plasticizing components (e.g., moisture, low-Tg API) lower the overall Tg.
Experimental Protocols for Investigation
Protocol A: Determining Formulation-Specific Tg
- Method: Modulated Differential Scanning Calorimetry (mDSC).
- Procedure:
- Precisely weigh 3-5 mg of sample (pure API, polymer, physical mixture, or spray-dried dispersion) into a T-zero hermetic pan.
- Seal the pan to maintain controlled moisture content.
- Equilibrate at 20°C below the expected Tg.
- Heat at 2-3°C/min with a modulation amplitude of ±0.5°C every 60 seconds under a nitrogen purge (50 mL/min).
- Analyze the reversible heat flow signal to identify the inflection point as Tg.
- Data Use: Input Tg values into the Gordon-Taylor equation to model plasticization effects.
Protocol B: Simulating Compression-Induced Temperature Rise
- Method: Instrumented Rotary Tablet Press with Infrared Thermography.
- Procedure:
- Set the main compression force to the target value (e.g., 15 kN).
- Adjust press speed to simulate production conditions (e.g., 30,000 tablets/hour).
- After reaching thermal equilibrium (∼30 min runtime), use a calibrated high-speed infrared camera focused on the tip of the lower punch just after tablet ejection.
- Record surface temperature for a minimum of 100 consecutive tablets.
- Calculate the mean peak ejection temperature (Tejection).
- Data Use: Tejection serves as a proxy for the maximum interfacial temperature (Tproc).
Protocol C: Quantitative Sticking Assessment
- Method: Gravimetric and Image Analysis of Punches.
- Procedure:
- Pre-weigh clean upper punches to a precision of 0.1 mg.
- Conduct a compression run for a specified number of tablets (e.g., 5,000).
- Post-run, carefully remove adhered powder from punches using a soft, non-abrasive brush.
- Weigh the punches again to determine mass gain.
- Simultaneously, capture high-resolution macro-images of the punch face. Use image analysis software to calculate the percentage area covered by adhered material.
- Data Use: Correlate sticking mass/area with the (Tproc - Tg) value.
Data Synthesis and Analysis
Table 1: Tg, Processing Temperature, and Sticking Propensity for Model Formulations
| Formulation Code | API Tg (°C) | Polymer | Blend Tg (Dry) (°C) | Moisture Content (%) | Effective Tg (Wet) (°C) | Tproc at Ejection (°C) | ΔT (Tproc - Tg) (°C) | Sticking Mass (mg/5k tabs) |
|---|---|---|---|---|---|---|---|---|
| F-01 | 45 | HPMCAS-LF | 72.1 | 1.5 | 68.5 | 41.2 | -27.3 | 0.5 |
| F-02 | 10 | PVP-VA64 | 52.3 | 2.0 | 45.8 | 48.5 | +2.7 | 15.8 |
| F-03 | 60 | HPMCAS-MF | 85.5 | 1.8 | 81.2 | 39.8 | -41.4 | 0.2 |
| F-04 | 10 | PVP-VA64 | 52.3 | 3.5 | 38.1 | 49.1 | +11.0 | 102.3 |
Key Insight: Sticking becomes severe (F-02, F-04) when Tproc exceeds effective Tg (ΔT > 0). Moisture content is a critical plasticizer, as seen in F-04, where it lowered Tg sufficiently to cause catastrophic sticking despite a moderate Tproc.
Mechanistic Pathways and Decision Logic
Logic for Tg-Based Sticking Risk Assessment
The Scientist's Toolkit: Key Research Reagent Solutions
Table 2: Essential Materials for Tg/Sticking Research
| Item / Reagent | Function & Rationale |
|---|---|
| Hydroxypropyl Methylcellulose Acetate Succinate (HPMCAS) | High Tg (~110-120°C) enteric polymer. Raises effective blend Tg, providing a wide margin below Tproc. Available in LG/MG/HG grades for solubility tuning. |
| Copovidone (PVP-VA64) | Lower Tg (~102°C) but excellent API dispersion polymer. More prone to plasticization; requires careful moisture and Tproc control. |
| Colloidal Silicon Dioxide | Common anti-sticking glidant. Reduces adhesion by coating powder particles and punch surfaces, modifying the interface. |
| Magnesium Stearate | Lubricant. Reduces friction, thereby lowering Tproc. Must be controlled for over-mixing to avoid softening and reduced tablet strength. |
| Hermetic DSC pans with seals | Essential for accurate Tg measurement by preventing moisture loss during heating, which would artifactually raise the observed Tg. |
| Standardized Tooling (e.g., 10mm round, flat) | Ensures consistent surface area and pressure during compression experiments, allowing for inter-study comparison. |
| Dynamic Vapor Sorption (DVS) Instrument | Quantifies moisture sorption isotherms. Critical for predicting the plasticizing effect of ambient humidity on effective Tg. |
| High-Speed IR Thermometer/Camera | Non-contact measurement of punch and tablet surface temperature during ejection to accurately determine Tproc. |
This technical guide is framed within a broader thesis on the definition and fundamental principles of the glass transition temperature (Tg). The Tg is a critical material property, marking the reversible transition from a hard, glassy state to a soft, rubbery state. For researchers in pharmaceuticals and material science, elevating Tg is paramount for enhancing the physical stability, mechanical integrity, and shelf-life of amorphous solid dispersions, polymeric coatings, and various drug delivery systems. Two primary, interrelated strategies for Tg elevation are judicious polymer selection and the deliberate exploitation of antiplasticization. This whitepaper provides an in-depth examination of these strategies, supported by current experimental data and methodologies.
Core Strategy I: Polymer Selection
The selection of a polymer with a high intrinsic Tg is the most direct method to elevate the overall Tg of a formulation. The Tg of a polymer is governed by its chemical structure: chain rigidity, intermolecular forces, and molecular weight.
Structural Determinants of High-Tg Polymers
- Chain Rigidity: Incorporation of bulky side groups (e.g., phenyl rings), cyclic structures in the backbone, or ladder polymers drastically reduces chain mobility, raising Tg.
- Intermolecular Forces: Strong secondary interactions such as hydrogen bonding, ionic interactions, and dipole-dipole forces between polymer chains increase the cohesive energy density, requiring more thermal energy to initiate segmental motion.
- Molecular Weight: Following the Flory-Fox equation, Tg increases with molecular weight until a critical point, after which it plateaus.
Quantitative Comparison of Common Pharmaceutical Polymers
Table 1: Glass Transition Temperatures of Selected Polymers
| Polymer Name | Chemical Family | Typical Tg Range (°C) | Key Structural Features Influencing Tg |
|---|---|---|---|
| Poly(acrylic acid) (PAA) | Polycarboxylate | 100 - 125 | Strong hydrogen bonding via carboxylic acid groups. |
| Poly(vinylpyrrolidone) (PVP) | Polyamide | 150 - 180 | Rigid pyrrolidone ring, strong dipole-dipole interactions. |
| Poly(vinyl acetate) (PVAc) | Polyvinyl ester | 30 - 40 | Flexible backbone, weak acetoxy side-group interactions. |
| Hydroxypropyl methylcellulose (HPMC) | Cellulose ether | 150 - 180 | Rigid glucose backbone, extensive hydrogen bonding. |
| Eudragit L100 (Methacrylic Acid Copolymer) | Methacrylate | >150 | Rigid backbone, hydrogen bonding from carboxylic acid. |
| Soluplus (PVP-VA-PEG) | Graft copolymer | ~70 | Plasticizing effect of PEG and VA segments lowers Tg. |
| Poly(lactic acid) (PLA) | Polyester | 55 - 60 | Semi-rigid backbone, moderate crystallinity can influence Tg. |
Experimental Protocol: Determining Polymer Tg via Differential Scanning Calorimetry (DSC)
Protocol Title: Measurement of Glass Transition Temperature Using Modulated DSC (mDSC) Objective: To accurately determine the Tg of a pure polymer or formulation. Materials: See "The Scientist's Toolkit" (Section 5). Methodology:
- Sample Preparation: Precisely weigh 3-10 mg of polymer into a tared, vented DSC aluminum pan. Hermetically seal the pan with a lid.
- Instrument Calibration: Calibrate the DSC for temperature and enthalpy using indium and zinc standards.
- Method Programming: Set a modulated DSC method. Example parameters:
- Equilibration: 20°C
- Ramp Rate: 2°C/min
- Modulation Amplitude: ±0.5°C
- Modulation Period: 60 seconds
- Purge Gas: Nitrogen at 50 mL/min
- Final Temperature: 30°C above the expected Tg.
- Run: Execute the method with the sample and an empty reference pan.
- Data Analysis: Analyze the reversible heat flow signal. The Tg is identified as a step-change in heat capacity. Report the onset, midpoint, and endpoint temperatures from the derivative curve for precision.
Core Strategy II: Antiplasticization
Antiplasticization is a paradoxical phenomenon where the addition of a small amount of a low molecular weight compound (an "antiplasticizer") increases the Tg and modulus of a polymer, contrary to the typical plasticizing effect.
The Dual-Role Mechanism
The mechanism is concentration-dependent:
- Low Concentration (Antiplasticization): The additive molecules fit into specific free volume pockets within the polymer matrix, forming strong, specific interactions (e.g., hydrogen bonds) with polymer chains. This reduces the overall free volume and restricts cooperative chain motions, thereby raising the Tg and increasing brittleness.
- High Concentration (Plasticization): As additive concentration increases, it occupies non-specific sites, diluting polymer-polymer interactions and increasing free volume, leading to the classic plasticizing effect (lowering Tg).
Quantitative Data on Antiplasticizer Efficacy
Table 2: Effect of Low-Concentration Additives on Polymer Tg
| Polymer (Tg°) | Additive (Antiplasticizer) | Additive Conc. (wt%) | Resultant Tg (°C) | % Change in Tg | Proposed Interaction |
|---|---|---|---|---|---|
| Poly(vinyl chloride) (85°C) | Bisphenol-A | 5% | 95 | +11.8% | H-bonding with Cl sites |
| Polysulfone (190°C) | 4,4'-Dichlorodiphenyl sulfone | 10% | 210 | +10.5% | Dipole-dipole, chain stiffening |
| Cellulose acetate (190°C) | Triphenyl phosphate | 15% | 205 | +7.9% | H-bonding with acetate groups |
| Poly(lactic acid) (55°C) | Lactic acid oligomer | 3% | 62 | +12.7% | Specific chain-end interactions |
Experimental Protocol: Evaluating Antiplasticization in Polymer-Drug Systems
Protocol Title: Mapping the Tg-Concentration Profile for Additive-Polymer Blends Objective: To identify the antiplasticization zone for a given polymer-additive system. Materials: See "The Scientist's Toolkit." Methodology:
- Blend Preparation: Prepare a series of binary blends of the polymer and the additive (e.g., a drug or stabilizer) across a concentration range (e.g., 0, 1, 3, 5, 10, 20, 30 wt%). Use solvent casting or melt quenching to create homogeneous amorphous films/disks.
- Tg Measurement: Analyze each blend using the mDSC protocol described in Section 2.3.
- Mechanical Testing (Optional): Perform dynamic mechanical analysis (DMA) or micro-indentation on select blends to correlate Tg elevation with an increase in storage modulus or hardness.
- Interaction Analysis: Use Fourier-Transform Infrared Spectroscopy (FTIR) to probe for specific molecular interactions (e.g., shifts in H-bonding peaks).
- Data Modeling: Plot Tg vs. additive weight fraction. Fit data to models like the Gordon-Taylor equation. Deviation from the predicted plasticizing curve at low concentrations indicates antiplasticization.
Visualizing Relationships and Workflows
Diagram Title: Strategies for Tg Elevation: A Decision Framework
Diagram Title: Antiplasticization vs. Plasticization Regimes
The Scientist's Toolkit: Essential Research Reagents & Materials
Table 3: Key Materials for Tg Elevation Studies
| Item/Category | Example Product/Specification | Function in Research |
|---|---|---|
| High-Tg Polymers | PVP K90 (Tg~175°C), HPMC AS (Tg~150°C), Eudragit L100 | Serve as the primary matrix. Selection directly determines baseline Tg. |
| Potential Antiplasticizers | Low-MW APIs (e.g., nitrendipine), stabilizers (e.g., BHT), plasticizer analogs (e.g., citrate esters) | Low-concentration additives used to probe and induce antiplasticization effects. |
| Thermal Analysis Consumables | Tzero Hermetic Aluminum Pans & Lids (TA Instruments) | Encapsulate samples for DSC to ensure controlled atmosphere and prevent volatilization. |
| Calibration Standards | Indium (Tm=156.6°C), Zinc (Tm=419.5°C), certified Heat Flow Calibrant | Calibrate DSC temperature, enthalpy, and heat flow response for accurate Tg measurement. |
| Spectroscopy Supplies | Potassium Bromide (KBr) for FTIR pellets, or ATR diamond crystal | Enable characterization of molecular interactions (H-bonding) driving antiplasticization. |
| Solvent for Casting | Anhydrous Acetone, Methanol, Dichloromethane (HPLC Grade) | Create homogeneous polymer-additive blends via solvent evaporation methods. |
The glass transition temperature (Tg) is a fundamental material property defining the reversible transition of an amorphous material from a hard, glassy state to a soft, rubbery state. This whitepaper frames the purposeful reduction of Tg within the broader thesis of understanding its definition and fundamental principles. For researchers in pharmaceutical development, manipulating Tg via plasticization is a critical strategy for engineering the performance of polymeric film coatings and stabilizing biologic formulations. This guide provides an in-depth technical exploration of current methodologies and applications.
Fundamental Principles of Plasticization
Plasticizers are low molecular weight, non-volatile substances added to polymers to increase flexibility, workability, and distensibility. Their primary mechanism is to insert themselves between polymer chains, increasing free volume and reducing the intensity of chain-chain interactions. This lowers the Tg by effectively increasing molecular mobility at lower temperatures. The extent of Tg depression is governed by the plasticizer's compatibility, molecular weight, and chemical structure.
Plasticizers in Polymeric Film Coatings for Oral Dosage Forms
Film coatings are applied to tablets for controlled release, taste masking, and protection. The Tg of common coating polymers (e.g., Eudragit, cellulose esters) is often above ambient temperature, necessitating plasticizers to prevent cracking and ensure a continuous film.
Table 1: Common Plasticizers and Their Effect on Tg of Coating Polymers
| Plasticizer | Typical Polymer (Example) | Typical Wt.% | Tg Depression Range (°C) | Key Properties |
|---|---|---|---|---|
| Triethyl Citrate (TEC) | Eudragit L100-55 | 10-25% | 15 - 40 | Hydrophilic, good compatibility |
| Dibutyl Sebacate (DBS) | Ethyl Cellulose | 15-30% | 20 - 50 | Hydrophobic, excellent flexibility |
| Polyethylene Glycol 400 (PEG 400) | HPMC | 5-20% | 10 - 30 | Hydrophilic, water-miscible |
| Triacetin | Cellulose Acetate | 10-20% | 10 - 25 | Good plasticizer, also a solvent |
| Acetyl Tributyl Citrate (ATBC) | Eudragit RS/RL | 10-30% | 20 - 45 | Lower volatility than TEC |
Experimental Protocol: Determination of Optimal Plasticizer Concentration (Film Flexibility)
- Preparation: Prepare polymer solutions (e.g., 10% w/w Eudragit RS in acetone) with plasticizer concentrations from 0-30% w/w of polymer.
- Casting: Cast the solutions onto release-lined plates using a calibrated draw-down bar to achieve uniform thickness (~100 µm).
- Drying: Allow films to dry at controlled temperature (25°C) and humidity (50% RH) for 24 hours.
- Conditioning: Condition dried films at 25°C/50% RH for 48 hours before testing.
- Testing: Cut films into strips. Measure tensile properties (modulus, elongation at break) using a micro-tensile tester. The optimal concentration is identified at the point where elongation at break plateaus or where modulus is sufficiently lowered for the application.
Plasticizers in Stabilization of Biologic Formulations
In lyophilized biologics (monoclonal antibodies, vaccines), amorphous stabilizers like sucrose and trehalose form a rigid glassy matrix with a high Tg. Residual water acts as a ubiquitous plasticizer, lowering the Tg. Purposeful addition of small-molecule excipients can modulate Tg' (the glass transition of the maximally freeze-concentrated solution) to improve process stability and shelf-life.
Table 2: Plasticizing Effect on Tg' in Lyophilized Biologic Formulations
| Formulation Component | Typical Conc. | Function | Approx. Tg' (°C) | Effect of 1% Added Plasticizer (ΔTg') |
|---|---|---|---|---|
| Sucrose | 5-10% w/v | Bulking Agent/Stabilizer | -32 to -34 | Decrease of 2-5°C |
| Trehalose Dihydrate | 5-10% w/v | Stabilizer | -30 to -32 | Decrease of 2-4°C |
| Sorbitol | 0.5-2% | Bulking Agent/Plasticizer | N/A (itself a plasticizer) | Decrease of 5-10°C |
| Glycerin | 0.1-1% | Stabilizer/Plasticizer | N/A (itself a plasticizer) | Decrease of 7-12°C |
| Residual Water | 0.5-3% | Inherent Plasticizer | N/A | Decrease of ~10°C per 1% (at low levels) |
Experimental Protocol: Measuring Tg' by Differential Scanning Calorimetry (DSC)
- Sample Preparation: Prepare 1 mL of the candidate biologic formulation in its final buffer with excipients.
- Loading: Precisely weigh 5-10 mg of the solution into a hermetically sealed Tzero DSC pan.
- Freezing: Cool the sample to -80°C at a rate of 10°C/min to ensure complete freezing.
- First Heating Scan: Heat the sample at 5°C/min to +20°C. The endothermic step change in the heat flow curve indicates the Tg' of the freeze-concentrated amorphous phase.
- Analysis: Use the midpoint of the transition step as the Tg' value. Compare formulations with and without purposeful plasticizers.
Visualization: The Plasticizer Selection and Evaluation Workflow
Title: Plasticizer Selection Workflow for Tg Reduction
The Scientist's Toolkit: Key Research Reagent Solutions
Table 3: Essential Materials for Plasticizer Research
| Item | Function / Relevance | Example Brands/Products |
|---|---|---|
| Model Polymers | For controlled film coating studies; vary in hydrophobicity & functional groups. | Eudragit series (Evonik), Ethyl Cellulose (Aquateric), HPMC (Pharmacoat). |
| Pharma-Grade Plasticizers | High-purity, low-toxicity agents for formulation screening. | Citrofol esters (Jungbunzlauer), Myvacet (acetylated monoglycerides). |
| Differential Scanning Calorimeter (DSC) | The primary instrument for precise measurement of Tg and Tg'. | TA Instruments Q series, Mettler Toledo DSC 3. |
| Dynamic Mechanical Analyzer (DMA) | Measures viscoelastic properties (modulus, tan δ) to probe Tg. | TA Instruments DMA 850, PerkinElmer DMA 8000. |
| Micro-Tensile Tester | Quantifies film mechanical properties (elongation, tensile strength). | Instron 5944 with small load cell, Deben Microtest. |
| Forced Degradation Chamber | For accelerated stability studies of plasticized films/formulations. | CARON 7000 series, Binder climate chambers. |
| Lyophilizer | For freeze-drying studies on plasticized biologic formulations. | SP Scientific VirTis, Millrock Technology REVO. |
Optimizing Drying and Storage Conditions Relative to Tg
This technical guide is framed within a broader research thesis on the fundamental principles of glass transition temperature (Tg). The thesis posits that Tg is not a fixed material property but a dynamic, history-dependent parameter, central to predicting and controlling the physicochemical stability of amorphous solids in pharmaceuticals. This document provides an in-depth analysis of how drying processes (lyophilization, spray drying) and storage conditions must be optimized relative to Tg to ensure long-term stability of biologics and small molecule drugs.
Fundamental Principles: Tgas a Stability Predictor
The glass transition temperature (Tg) demarcates the transition from a brittle, glassy state to a viscous, rubbery state. In the glassy state (T < Tg), molecular mobility is drastically reduced, inhibiting degradation pathways (e.g., chemical reactions, protein aggregation, crystallization). As the storage temperature (T) approaches or exceeds Tg, molecular mobility increases exponentially, leading to rapid loss of stability. The critical parameter is (T - Tg), often termed the "delta T." Stability is generally maintained when T < Tg - 20°C to 50°C, depending on the system's sensitivity.
Quantitative Data on Tgand Stability
Table 1: Representative Tg Values and Critical Storage Temperatures for Common Pharmaceutical Excipients and Formulations
| Material / Formulation | Tg (Dry, °C) | Tg' (Max. Freeze-Conc., °C) | Recommended Max. Storage T for Stability (T < Tg - K) | Key Degradation Risk Above Tg |
|---|---|---|---|---|
| Sucrose | 70-75 | -32 to -34 | 25°C (assumes dry) | Crystallization, Maillard reactions |
| Trehalose | 115-120 | -29 to -30 | 25°C (assumes dry) | Crystallization (if dihydrate forms) |
| PVP K30 | ~160 | ~-21 | 40°C | Hygroscopic, plasticization |
| mAb in Sucrose (1:1) | ~70-75 (dry) | ~-30 | 2-8°C (if RH controlled) | Aggregation, Deamidation |
| Spray-Dried Dispersion (Itraconazole/HPMC) | ~100 | N/A | 25°C (dry) | Crystallization of API |
Table 2: Effect of Residual Moisture on Tg
| Formulation | Dry Tg (°C) | Tg at 2% Moisture (°C) | Tg at 5% Moisture (°C) | Plasticization Effect (ΔTg/%w moisture) |
|---|---|---|---|---|
| Sucrose | 72 | ~35 | < 0 (rubbery) | ~ -15 °C/% |
| Trehalose | 117 | ~90 | ~50 | ~ -13 °C/% |
| Amorphous Lactose | 101 | ~50 | ~20 | ~ -16 °C/% |
Optimizing Drying Conditions Relative to Tg
4.1 Lyophilization (Freeze-Drying)
- Primary Drying: Conducted below the collapse temperature (Tc), which is closely related to Tg'. Maintaining product temperature (Tp) < Tg' (typically by 2-5°C) prevents viscous flow and macroscopic collapse, preserving cake structure and porosity.
- Secondary Drying: Aims to reduce residual moisture to a level that raises the final product Tg well above the intended storage temperature. A target is often Tg > storage T + 50°C.
Protocol 4.1: Determination of Tg' and Collapse Temperature via Freeze-Dry Microscopy (FDM)
- Sample Preparation: Place a small volume (2-5 µL) of the formulated drug solution on a temperature-controlled microscope stage fitted with a vacuum chamber.
- Freezing: Cool the stage to -50°C at 10°C/min to fully freeze the sample.
- Primary Drying Simulation: Apply a vacuum (< 200 mTorr) and gradually increase the stage temperature at 0.5-2°C/min.
- Observation: Monitor the sample structure via polarized light. The temperature at which the microstructure begins to lose its original frozen morphology (e.g., collapse, shrinkage) is recorded as the collapse temperature (Tc).
- Analysis: Tc is used as a practical proxy for Tg' to set the safe product temperature for primary drying.
4.2 Spray Drying
- Outlet Temperature (Tout): The most critical parameter. Must be optimized so that Tout > Tg of the forming particle to ensure rapid solidification into a glass, but not so high as to cause stickiness or degradation. Ideally, Tout is set 10-20°C above the Tg of the formulation at the moment of drying.
Protocol 4.2: Determining Optimal Spray Drying Outlet Temperature
- Thermal Analysis: Determine the dry Tg of the formulation blend using Differential Scanning Calorimetry (DSC).
- Pilot Runs: Perform spray drying runs at varying inlet temperatures and feed rates to achieve a range of outlet temperatures (e.g., from Tg-10°C to Tg+40°C).
- Particle Analysis: Collect product from each run. Analyze for:
- Yield: Mass of collected powder vs. total solids fed.
- Stickiness: Visual inspection of cyclone/chamber walls.
- Residual Moisture: Karl Fischer titration.
- Physical State: XRPD to confirm amorphous content.
- Optimization: Select the Tout that maximizes yield, maintains amorphous state, and minimizes moisture, typically found to be just above the measured Tg.
Optimizing Storage Conditions Relative to Tg
Storage stability requires maintaining the amorphous solid in the glassy state. The two key factors are temperature and relative humidity (RH), the latter affecting moisture sorption and Tg depression.
Protocol 5.1: Construction of a Stability Prediction Map (Gordon-Taylor & ASLT)
- Moisture Sorption Isotherm: Determine equilibrium moisture content at various RH levels at 25°C.
- Tg Depression Modeling: Fit the Gordon-Taylor equation to experimental Tg vs. moisture content data:
T*g*(mix) = (w1*T*g1 + k*w2*T*g2) / (w1 + k*w2), where w1, Tg1 are for dry solid, w2, Tg2 for water, and k is a fitting constant. - Calculate Tg vs. RH: Use the sorption isotherm and Gordon-Taylor fit to predict Tg at any storage RH.
- Accelerated Stability Testing: Store samples at elevated temperatures (e.g., 40°C, 60°C) and various RH levels. Monitor key stability indicators (e.g., potency, related substances, dissolution).
- Map Creation: Plot storage T and RH axes. Overlay calculated Tg contours. Mark regions where stability failed in ASLT. The "stable" zone will align with conditions where (Storage T << Predicted Tg).
Visualizations
Diagram 1: Stability Decision Logic Based on T and Tg
Diagram 2: T_g Depression by Moisture During Storage
The Scientist's Toolkit: Key Research Reagent Solutions
Table 3: Essential Materials for T_g-Focused Drying & Storage Research
| Item | Function / Relevance |
|---|---|
| Differential Scanning Calorimeter (DSC) | The primary tool for direct experimental determination of Tg and Tg' by measuring heat flow changes. |
| Dynamic Vapor Sorption (DVS) Analyzer | Precisely measures moisture sorption isotherms, critical for modeling Tg depression by humidity. |
| Freeze-Dry Microscope (FDM) | Visually determines collapse temperature (Tc) and eutectic melt temperature to guide lyophilization cycle development. |
| Karl Fischer Titrator | Accurately measures residual moisture content in dried products, a key variable affecting Tg. |
| Modulated DSC (mDSC) | Separates reversible (heat capacity change at Tg) from non-reversible thermal events, improving Tg detection in complex formulations. |
| Stability Chambers (with RH control) | For conducting accelerated stability studies at precise Temperature and Humidity conditions relative to predicted Tg. |
| Model Excipients (Sucrose, Trehalose, PVP) | Well-characterized amorphous formers with known Tg values, used as benchmarks and stabilizers in formulation studies. |
| Hermetic DSC Pans with Sealing Press | Ensures no moisture loss/gain during Tg measurement, providing reliable data. |
Validating Tg Data: Method Comparisons and Establishing Tg as a Critical Quality Attribute (CQA)
This whitepaper presents a comparative analysis of three pivotal thermal and thermo-mechanical analysis techniques—Differential Scanning Calorimetry (DSC), Dynamic Mechanical Analysis (DMA), and Dielectric Analysis (DEA)—within the context of a broader thesis on the definition and fundamental principles of the glass transition temperature (Tg). The accurate determination of Tg is critical in polymer science and pharmaceutical development, as it governs material properties like stability, brittleness, and diffusion rates. Each technique probes the molecular mobility associated with the glass transition through different physical principles, leading to variations in reported values and insights. This guide details their operational strengths, inherent limitations, and the correlation of data, providing researchers and drug development professionals with a framework for selecting and interpreting these complementary methods.
Fundamental Principles and Measurement Context
The glass transition is a reversible change in an amorphous material or amorphous regions within a semicrystalline material from a hard, glassy state to a viscous, rubbery state. It is characterized not by a single temperature but by a temperature range. The measured Tg is inherently dependent on the experimental timescale and the specific molecular motions probed by the technique.
- DSC measures heat flow differences, detecting changes in heat capacity (Cp) as the material's molecular mobility increases.
- DMA applies a periodic oscillatory stress, measuring the material's viscoelastic response (storage modulus E', loss modulus E'', and tan δ) to mechanical deformation.
- DEA applies an oscillatory electric field, measuring the material's permittivity (ε') and loss factor (ε'') in response to the reorientation of molecular dipoles.
Experimental Protocols
Differential Scanning Calorimetry (DSC)
Protocol for Tg Determination (Pharmaceutical Amorphous Solid Dispersion):
- Sample Preparation: Precisely weigh 5-10 mg of the solid dispersion into a crimped aluminum crucible. An empty, crimped crucible serves as the reference.
- Calibration: Calibrate the instrument for temperature and enthalpy using indium and zinc standards.
- Experimental Run: Perform a heat-cool-heat cycle under a nitrogen purge (50 mL/min).
- First Heating: Equilibrate at 0°C, then heat to 20°C above the expected melting point at a rate of 10°C/min. This erases thermal history.
- Cooling: Cool rapidly to 0°C at 50°C/min.
- Second Heating: Reheat at 10°C/min to a suitable final temperature. The Tg is analyzed from this second heating curve.
- Data Analysis: Identify the glass transition as a step change in heat flow. The Tg is typically reported as the midpoint of the step change in the heat flow curve.
Dynamic Mechanical Analysis (DMA)
Protocol for Tg Determination of a Polymer Film:
- Sample Preparation: Cut a film to dimensions suitable for the clamp (e.g., tension or film tension). Typical dimensions are 10-20 mm length, 5-10 mm width, and 0.05-0.2 mm thickness.
- Mounting: Secure the sample in the clamps, ensuring it is taut and aligned. Adjust the static force to prevent slack during thermal contraction.
- Experimental Parameters: Set an oscillatory strain amplitude within the linear viscoelastic region (e.g., 0.01%), a frequency (e.g., 1 Hz), and a heating rate (e.g., 3°C/min).
- Temperature Ramp: Run the experiment from sub-Tg temperature (e.g., -50°C) to above Tg (e.g., 150°C).
- Data Analysis: Identify Tg from the peak of the tan δ curve or the onset of the rapid drop in the storage modulus (E').
Dielectric Analysis (DEA)
Protocol for Cure Monitoring and Tg Determination of an Epoxy Resin:
- Sensor and Sample Preparation: Apply a thin layer of the uncured resin onto a ceramic interdigitated electrode sensor. For solids, a pellet may be pressed between parallel plate electrodes.
- Connection: Connect the sensor to the DEA instrument.
- Experimental Parameters: Set a frequency sweep (e.g., 0.1 Hz to 10,000 Hz) or a fixed frequency (e.g., 10 Hz or 1000 Hz). For cure monitoring, an isothermal temperature is set. For Tg scans, define a heating rate (e.g., 3°C/min).
- Run: Initiate the experiment, measuring the permittivity (ε') and loss factor (ε'') as a function of time or temperature.
- Data Analysis: The peak in the loss factor (ε'') or the dramatic drop in permittivity (ε') corresponds to the glass transition, representing a critical drop in molecular mobility.
Table 1: Core Characteristics and Data Correlation
| Feature | Differential Scanning Calorimetry (DSC) | Dynamic Mechanical Analysis (DMA) | Dielectric Analysis (DEA) |
|---|---|---|---|
| Primary Measurand | Heat Flow (dQ/dt) | Stress & Strain (Modulus, Tan δ) | Capacitance & Conductance (Permittivity ε'', Loss ε'') |
| Probes | Change in Heat Capacity (Cp) | Mechanical Mobility (Viscoelasticity) | Dipolar & Ionic Mobility |
| Typical Tg Output | Midpoint of Cp Step | Peak of Tan δ curve | Peak of Loss Factor (ε'') |
| Reported Tg Value | Usually Lowest | 10-20°C higher than DSC | Can vary widely; sensitive to dipole presence |
| Key Strengths | Quantitative, measures enthalpy events (melting, crystallization), fast screening. | High sensitivity to subtle transitions, measures modulus directly, broad frequency range. | Exceptional sensitivity to mobility, broad frequency range (mHz-MHz), ideal for cure monitoring. |
| Key Limitations | Low sensitivity for weak transitions, small sample size, indirect mechanical property assessment. | Sample geometry critical, clamping can be challenging for films/soft materials. | Requires dipoles or ions for signal, electrode contact issues, data interpretation can be complex. |
| Sample Form | Solids (mg quantities) | Films, fibers, bars, liquids (mm dimensions) | Liquids, pastes, films, solids |
| Frequency Range | Quasi-static (scanning) | 0.001 - 200 Hz | 0.001 Hz - 1 MHz |
Table 2: Application-Specific Suitability
| Application Context | Recommended Primary Technique | Complementary Technique(s) | Rationale |
|---|---|---|---|
| Amorphous Drug Stability Screening | DSC | DEA | DSC provides fast Tg and crystallization enthalpy. DEA probes molecular mobility below Tg (β-relaxations) linked to stability. |
| Polymer Film Coating Characterization | DMA | DSC | DMA directly measures coating stiffness (E') and damping (tan δ) vs. T. DSC confirms absence of melting and gives baseline Tg. |
| Epoxy Resin Cure Kinetics | DEA | DSC | DEA tracks viscosity and vitrification in-situ in real-time. DSC measures residual cure heat and final Tg. |
| Detection of Secondary Relaxations | DMA or DEA | - | Both are highly sensitive to sub-Tg molecular motions (β, γ relaxations) critical for impact strength and barrier properties. |
The Scientist's Toolkit: Essential Research Reagent Solutions
| Item | Function in Analysis |
|---|---|
| Hermetic Aluminum DSC Crucibles | Seals sample to prevent mass loss (e.g., solvent, decomposition) and ensure accurate heat flow measurement. |
| Standard Reference Materials (Indium, Zinc) | Calibrates DSC temperature and enthalpy scale for accurate, reproducible thermal data. |
| Silicone Oil or High-Vacuum Grease | Improves thermal contact between sample and DSC pan or DMA clamp, reducing thermal lag. |
| Interdigitated Electrode (IDE) Sensors | The core DEA consumable; applies the electric field to the sample surface for dielectric measurement. |
| Quartz or Ceramic Parallel Plate Sensors | Used in DEA for bulk measurements of liquids or compressed solids, minimizing electrode polarization effects. |
| Dynamic Mechanical Analysis Clamps | Various geometries (tension, shear, 3-point bend) to accommodate different sample forms and moduli. |
| Inert Gas Supply (N₂) | Provides purge gas for all instruments to prevent oxidative degradation during heating scans. |
Methodological Relationships and Workflow
Figure 1: Decision Flow for Tg Measurement Technique Selection
Figure 2: Experimental Workflow Comparison for Tg Analysis
DSC, DMA, and DEA are indispensable, complementary tools for defining and understanding the glass transition. DSC provides a thermodynamic baseline, DMA delivers direct mechanical property correlation with high sensitivity, and DEA offers unparalleled depth in probing molecular mobility over a vast frequency range. The reported Tg values will systematically differ due to the different underlying phenomena measured. Therefore, within the context of fundamental research on Tg, data from these techniques should not be viewed as contradictory but as facets of a complete picture. A robust material characterization strategy involves correlating data from at least two of these methods to fully describe the glass transition's nature and its implications for material performance, particularly in advanced applications like drug formulation and polymer design.
Within the broader thesis on defining the glass transition temperature (Tg) and its fundamental principles, a critical challenge emerges: the apparent discrepancy between the macroscopic, bulk Tg and the underlying molecular motions characterized by local mobility and beta relaxations. While bulk Tg, measured via calorimetry or rheology, marks a dramatic change in global properties (e.g., viscosity, heat capacity), it often fails to capture the rich spectrum of localized, non-cooperative dynamics that persist far below this nominal transition. This whitepaper provides an in-depth technical guide to understanding the origins, measurement, and implications of these discrepancies, particularly relevant for the stabilization of amorphous pharmaceuticals and advanced polymeric materials.
Fundamental Principles: Defining the Transitions
- Bulk (or Alpha) Glass Transition (Tg_α): A cooperative, homogeneous phenomenon where long-range segmental motion ceases upon cooling. It is a thermodynamic and kinetic transition measured on a macroscopic scale. The Vogel-Fulcher-Tammann equation describes its temperature dependence, highlighting its cooperative nature.
- Local Mobility (& Beta Relaxations): These are secondary relaxations involving localized, non-cooperative motions. They can be Johari-Goldstein (JG) beta relaxations (involving the entire molecule or large side groups) or non-JG beta relaxations (involving smaller, more localized intramolecular units). These motions are active well below the bulk Tg and follow an Arrhenius temperature dependence.
The core discrepancy arises because bulk Tg measurement techniques are sensitive to the percolation of cooperative motions, while local mobility probes operate on shorter length and timescales. The two are decoupled, leading to situations where a material with identical bulk Tg can exhibit vastly different local mobility profiles, critically impacting properties like physical stability, diffusion, and chemical reactivity.
Quantitative Data & Comparative Analysis
The following table summarizes key characteristics and quantitative relationships between bulk Tg and local relaxations.
Table 1: Comparative Analysis of Bulk Tg (α) and Beta Relaxations
| Feature | Bulk (Alpha) Relaxation | Beta Relaxation (Johari-Goldstein Type) |
|---|---|---|
| Nature | Cooperative, long-range segmental motion | Localized, non-cooperative motion |
| Length Scale | Large (several monomer units) | Small (single molecule/side group) |
| Temperature Dependence | Strongly non-Arrhenius (VFT: τ = τ₀ exp[DT₀/(T-T₀)]) | Approximates Arrhenius (τ = τ₀ exp[Eₐ/(RT)]) |
| Activation Energy (Eₐ) | Effectively infinite at Tg | Typically 20-40 RTg (≈ 25-60 kJ/mol) |
| Relation to Tg | Defines Tg (τ_α(Tg) ~ 100 s) | Onset often occurs at T~0.7-0.8 Tg (in Kelvin) |
| Primary Measurement | DSC, DMA, Dielectric Spectroscopy (low freq) | Dielectric Spectroscopy (high freq/low T), NMR, SLR |
| Impact on Stability | Governs global viscosity & crystallization onset | Controls local diffusion, chemical degradation, & physical aging below Tg |
Table 2: Experimental Tg vs. Local Relaxation Onset for Model Systems
| Material System | Bulk Tg (DSC, °C) | Beta Relaxation Onset (T_β, °C) | Ratio T_β / Tg (K) | Key Implication |
|---|---|---|---|---|
| Sucrose | 70 | ~-20 | ~0.75 | Significant mobility exists 90°C below Tg |
| Indomethacin | 50 | ~-10 | ~0.78 | Correlates with instability in amorphous solid dispersions |
| Poly(methyl methacrylate) | 105 | ~40 | ~0.80 | Localized ester group rotation impacts toughness |
| Sorbitol | -5 | ~-70 | ~0.72 | JG β-relaxation linked to water binding stability |
Experimental Protocols for Discrepancy Analysis
Protocol: Dielectric Spectroscopy (BDS) for Full Spectra Characterization
- Objective: To simultaneously characterize the temperature and frequency dependence of both α and β relaxations.
- Methodology:
- Sample Preparation: Prepare an amorphous film or powder. For hygroscopic materials (e.g., APIs), dry and handle in a controlled atmosphere (e.g., glove box).
- Cell Assembly: Sandwich sample between two parallel plate gold or brass electrodes. Apply consistent, gentle pressure to ensure good contact.
- Temperature Ramp: Place cell in a nitrogen-purged cryostat or oven. Perform a frequency sweep (typically 10⁻¹ to 10⁶ Hz) at isothermal steps (2-5 K intervals) from well below to above the expected Tg.
- Data Collection: Measure complex permittivity (ε* = ε' - iε'').
- Analysis: Fit ε'' spectra to model functions (e.g., Havriliak-Negami for α, Cole-Cole for β). Extract relaxation times (τ_max) for each process. Plot log(τ) vs. 1/T to differentiate VFT (α) and Arrhenius (β) behaviors.
Protocol: Modulated DSC for Bulk Tg & Enthalpy Recovery
- Objective: Precisely measure the bulk Tg and quantify physical aging linked to slow β-processes.
- Methodology:
- Calibration: Calibrate DSC cell for temperature and enthalpy using indium and sapphire standards.
- Sample Loading: Load 3-10 mg of sample in a hermetically sealed pan.
- Temperature Modulation: Employ a modulated temperature program (e.g., average heating rate 2 K/min, modulation ±0.5 K every 60 s).
- Scan: Cool from above Tg to an aging temperature (Tg - 20 K) at a controlled rate. Hold isothermally for a defined aging time (t_aging). Reheat through Tg using the modulated program.
- Analysis: Determine Tg from the midpoint of the reversing heat flow signal. Quantify the enthalpy recovery peak (non-reversing heat flow) associated with the decay of excess enthalpy gained during aging—a process driven by local mobility.
Protocol: Solid-State NMR for Site-Specific Local Mobility
- Objective: Probe local molecular motions on the 1-100 nm scale and angstrom-level chemical sites.
- Methodology:
- Nucleus Selection: Use ¹³C or ²H for organic systems. ¹³C CP/MAS for general structure; ²H for specific dynamics via line shape analysis.
- Sample Preparation: For ²H NMR, selectively deuterate molecules at sites of interest.
- Variable Temperature Experiment: Acquire spectra across a temperature range spanning Tβ to Tg.
- Relaxation Measurements: Perform spin-lattice relaxation (T₁) and rotating-frame relaxation (T₁ρ) experiments. T₁ρ is particularly sensitive to slow motions (10⁻³ to 10⁻⁶ s) near Tg.
- Analysis: Model relaxation rates and line shapes to extract correlation times and activation energies for specific molecular moieties.
Visualization of Concepts & Workflows
The Scientist's Toolkit: Key Research Reagent Solutions
Table 3: Essential Materials & Reagents for Mobility Studies
| Item | Function & Rationale |
|---|---|
| High-Purity Model Glass Formers (e.g., Sorbitol, Indomethacin, Toluene derivatives) | Well-characterized systems with known relaxation behaviors for method calibration and fundamental study. |
| Chemically Deuterated Compounds (Site-specific ²H labeling) | Enables precise probing of local dynamics via ²H Solid-State NMR line shape analysis. |
| Hermetic DSC Sample Pans (e.g., Tzero pans with lids) | Ensures no sample loss or contamination during modulated DSC runs, crucial for accurate Tg and enthalpy recovery measurement. |
| Parallel Plate Electrodes for BDS (Gold-plated, diameter ~10-20 mm) | Provides uniform electric field for dielectric measurements; gold minimizes oxidation and contact resistance. |
| Inert Atmosphere Glove Box (N₂ or Ar, <1% RH) | Prevents moisture absorption by hygroscopic glassy samples (especially APIs/polymers) during preparation, which plasticizes and alters dynamics. |
| Standard Reference Materials (Indium, Sapphire for DSC; calibration liquids for BDS) | Essential for instrument calibration, ensuring accuracy and reproducibility of Tg and relaxation time data. |
| Fitting Software (e.g., Origin with relaxation models, specialized tools like RelaxIS) | For modeling complex dielectric/NMR data with Havriliak-Negami, Cole-Cole, or Kohlrausch-Williams-Watts functions to extract relaxation parameters. |
The Relationship Between Tg, Collapse Temperature (Tc), and Eutectic Melting
Thesis Context: This whitepaper is framed within broader research into the fundamental principles defining the glass transition temperature (Tg) in amorphous solids, with a specific focus on implications for lyophilization process development in pharmaceutical sciences.
In the context of lyophilization (freeze-drying) of biopharmaceuticals, the glass transition temperature of the maximally freeze-concentrated solute (Tg') and the collapse temperature (Tc) are critical parameters that define the primary drying conditions. Eutectic melting behavior, relevant for crystalline systems, presents a distinct thermal event. Understanding the interplay between these phenomena is essential for developing stable, efficacious lyodrugs.
Fundamental Definitions and Quantitative Data
Table 1: Key Thermal Parameters in Lyophilization
| Parameter | Symbol | Definition | Typical Range for Sucrose-Based Formulations | Deterministic Method |
|---|---|---|---|---|
| Glass Transition (max freeze conc.) | Tg' | Temp at which amorphous freeze-concentrate undergoes glass transition. | -32°C to -40°C | Differential Scanning Calorimetry (DSC) |
| Collapse Temperature | Tc | Highest product temp at which viscous flow causes loss of microstructure. | Usually 1-3°C above Tg' | Freeze-Dry Microscopy (FDM) |
| Eutectic Melting Temperature | Teu | Temp at which a crystalline frozen phase melts. | Varies by crystalline solute (e.g., NaCl: -21.3°C) | DSC (endothermic peak) |
| Onset of Ice Melting | Tm | Melting point of ice in the system. | 0°C (depressed by solutes) | DSC |
Table 2: Comparative Thermal Behavior of Common Excipients
| Excipient | State in Frozen Solution | Tg' (°C) | Tc (°C) | Teu (°C) | Critical Temp for Primary Drying* |
|---|---|---|---|---|---|
| Sucrose | Amorphous | -32 ± 2 | -31 ± 2 | N/A | Tc (-31°C) |
| Trehalose | Amorphous | -30 ± 2 | -29 ± 2 | N/A | Tc (-29°C) |
| Mannitol (crystalline) | Crystalline (with amorphous fraction) | ~ -30 (amorphous fraction) | N/A | -1.5 to -3.5 | Teu (~ -2°C) |
| NaCl | Crystalline | N/A | N/A | -21.3 | Teu (-21.3°C) |
| Glycine (crystalline) | Crystalline | N/A | N/A | -3.5 | Teu (-3.5°C) |
*The lower of Tc or Teu typically sets the maximum allowable product temperature during primary drying.
Experimental Protocols for Determination
Differential Scanning Calorimetry (DSC) for Tg' and Teu
- Objective: To determine the glass transition temperature of the maximally freeze-concentrated solute (Tg') and identify eutectic melting events (Teu).
- Protocol:
- Sample Preparation: Load 5-20 mg of formulated solution into a hermetic DSC pan. Seal the pan to prevent evaporation. An empty pan serves as a reference.
- Freezing: Cool the sample to at least -50°C at a controlled rate (e.g., 5°C/min).
- Re-warming: Heat the sample at a standard rate (2-5°C/min) to above 0°C.
- Data Analysis: Analyze the thermogram. Tg' is identified as a step-change in heat capacity (midpoint or onset). A sharp endothermic peak indicates eutectic melting (Teu). For Tg', a second scan (re-heating after annealing) often provides a clearer signal.
Freeze-Dry Microscopy (FDM) for Collapse Temperature (Tc)
- Objective: To visually determine the temperature at which structural collapse occurs in the frozen matrix.
- Protocol:
- Sample Loading: Place a small droplet (2-5 µL) of the formulated solution between two cover slips on a temperature-controlled FDM stage.
- Freezing: Rapidly freeze the sample to below -50°C.
- Primary Drying Simulation: Under controlled vacuum (e.g., 100 mTorr), gradually increase the stage temperature (e.g., 0.5°C/min) while observing via polarized light.
- Endpoint Detection: Tc is recorded as the temperature at which the first sign of viscous flow and loss of original microstructure (e.g., pore boundaries) is observed.
Visualizing the Interrelationships
Diagram 1: Decision Pathway for Lyophilization Critical Temperature
Diagram 2: Process Parameters vs. Product Critical Temperature
The Scientist's Toolkit: Research Reagent Solutions
Table 3: Essential Materials for Tg', Tc, and Teu Analysis
| Item | Function in Research | Key Consideration |
|---|---|---|
| Modulated DSC | Accurately measures weak thermal transitions like Tg' by separating reversing (heat capacity) and non-reversing events. | Essential for complex biologics formulations with overlapping thermal events. |
| Freeze-Dry Microscope with Vacuum Stage | Directly observes structural collapse (Tc) under simulated primary drying conditions. | Video recording capability is crucial for pinpointing the exact temperature of collapse onset. |
| Hermetic DSC Pans | Encapsulates liquid samples for analysis, preventing solvent loss during heating scans. | Must be sealed properly; pinhole pans can be used for controlled drying studies. |
| Model Lyophilization Excipients (e.g., Sucrose, Trehalose, Mannitol) | Well-characterized amorphous and crystalline formers used to benchmark behavior and validate methods. | Purity and source can affect thermal data; use pharmaceutical grade. |
| Thermal Annealing Accessories | Enables controlled thermal treatment of frozen samples to promote crystallization or maximize freeze concentration. | Used in DSC protocols to clarify Tg' by devitrification of amorphous phases. |
| Lyophilization Formulation Buffers (e.g., Histidine, Phosphate, Citrate) | Provide pH control; their own thermal properties (Tg', crystallization tendency) must be characterized. | Buffer type and concentration can significantly shift Tg' and Tc. |
Within the broader research thesis on the definition and fundamental principles of the glass transition temperature (Tg), its role as a critical quality attribute (CQA) in pharmaceutical development is paramount. This whitepaper examines the regulatory perspective on Tg, framing it as a physicochemical CQA essential for ensuring the stability, performance, and manufacturability of amorphous solid dispersions, lyophilized products, and other polymeric or biopharmaceutical systems. The integration of Tg into a Quality-by-Design (QbD) framework aligns regulatory expectations with a science and risk-based approach to development.
Tg as a Critical Quality Attribute (CQA)
The glass transition is a second-order phase transition where an amorphous material changes from a brittle, glassy state to a softer, rubbery or viscous state upon heating. From a regulatory standpoint, a CQA is a physical, chemical, biological, or microbiological property that must be within an appropriate limit, range, or distribution to ensure the desired product quality. Tg directly qualifies due to its influence on:
- Chemical Stability: Molecular mobility increases dramatically above Tg, accelerating degradation reactions (e.g., hydrolysis, oxidation).
- Physical Stability: For amorphous solids, storage above Tg leads to crystallization, compromising dissolution and bioavailability.
- Mechanical Properties: Affects tablet compaction, film coating integrity, and handling of lyophilized cakes.
- Product Performance: Governs the reconstitution time of lyophilized biologics and the drug release profile from polymeric matrices.
Regulatory guidelines, such as ICH Q8(R2) on Pharmaceutical Development and ICH Q1A(R2) on Stability Testing, implicitly support the monitoring of state transitions, establishing Tg's foundational role in control strategies.
Tg in the QbD Framework
Quality-by-Design is a systematic approach to development that begins with predefined objectives and emphasizes product and process understanding and control. The integration of Tg is demonstrated across key QbD elements:
Quality Target Product Profile (QTPP) → CQA Identification: A target for storage conditions (e.g., room temperature) directly links to the requirement that the product Tg must be sufficiently higher than the storage temperature to maintain a glassy state.
Risk Assessment: Tg is a key parameter in tools like Failure Mode and Effects Analysis (FMEA). For example, a low Tg relative to storage temperature is a high-risk failure mode for physical instability.
Design Space: The relationship between formulation composition (e.g., plasticizer content, polymer-drug ratio) and process parameters (e.g., lyophilization primary drying temperature, spray-drying outlet temperature) on Tg can be modeled to establish a multidimensional design space.
Control Strategy: Tg is monitored as a material attribute (e.g., of incoming polymeric excipients) and/or as a product attribute (e.g., via Modulated Differential Scanning Calorimetry (mDSC) on final solid dispersion). Real-time release testing may involve predictive models based on Tg.
Lifecycle Management: Tracking Tg stability over the product shelf-life confirms the ongoing effectiveness of the control strategy.
Table 1: Impact of Excipients and Moisture on Tg of Amorphous Systems
| System / Drug (Tg dry) | Plasticizer / Condition | Resulting Tg (°C) | Key Implication |
|---|---|---|---|
| Amorphous Sucrose (70°C) | 1% w/w Moisture | ~55°C | Highlights sensitivity to humidity; requires rigorous dessication. |
| Itraconazole-Soluplus Dispersion | 20% Drug Loading | ~90°C | Demonstrates anti-plasticization effect of drug on polymer. |
| Lyophilized mAb Formulation | 5% Sucrose | ~65°C | Tg must be > maximum storage temp (e.g., 25°C) to ensure cake stability. |
| Spray-Dried Dispersion (HPMCAS) | 10% Moisture Uptake | Tg reduction of 15-20°C | Quantifies water's plasticizing effect; critical for packaging design. |
Table 2: Regulatory and Compendial References for Tg Measurement
| Document | Relevance to Tg | Key Point |
|---|---|---|
| ICH Q8(R2) | Pharmaceutical Development | Supports identification of CQAs like Tg linked to product performance. |
| ICH Q1A(R2) | Stability Testing | Supports studying phase transitions (like glass transition) under stress conditions. |
| USP <891> | Thermal Analysis | Provides general guidance on techniques like DSC, which measures Tg. |
| FDA Guidance on ANDAs for ASD (Draft, 2021) | Amorphous Solid Dispersions | Specifically recommends characterization of Tg and its relationship to physical stability. |
Experimental Protocols for Tg Determination
Protocol 1: Modulated Differential Scanning Calorimetry (mDSC) for Amorphous Solid Dispersions
- Objective: To accurately determine the glass transition temperature of a polymeric amorphous solid dispersion, separating reversible (Tg) from non-reversible (enthalpy relaxation, crystallization) thermal events.
- Equipment: mDSC with refrigerated cooling system, Tzero or standard aluminum pans, analytical balance.
- Procedure:
- Sample Preparation: Accurately weigh 5-10 mg of powder into a Tzero hermetic pan. Seal the pan with a lid using a press. Prepare an empty sealed pan as a reference.
- Method Development: Use a heat-only method to estimate Tg. Then apply a modulated method: Equilibrate at 0°C. Ramp at 2°C/min to a temperature 30°C above the estimated Tg, with a modulation amplitude of ±0.5°C every 60 seconds.
- Data Analysis: Analyze the Reversing Heat Flow signal. The Tg is identified as the midpoint of the step-change in heat capacity. Report onset, midpoint, and endpoint temperatures. Analyze the Non-Reversing Heat Flow for events like crystallization exotherms.
Protocol 2: Dynamic Mechanical Analysis (DMA) for Film Coatings or Polymeric Matrices
- Objective: To measure the Tg of free films or compacts based on changes in mechanical modulus (e.g., storage modulus, E'), which is often more sensitive to the rubbery transition than DSC.
- Equipment: DMA in tension or film/fiber clamp mode.
- Procedure:
- Sample Preparation: Prepare a free film of the coating formulation or a compacted specimen of the polymeric matrix with uniform dimensions (e.g., 10mm x 5mm x 0.5mm).
- Method: Clamp the sample. Apply a static force to maintain tension and a dynamic oscillatory strain (e.g., 0.1% at 1 Hz). Ramp temperature from -50°C to 150°C at 3°C/min.
- Data Analysis: Plot storage modulus (E') and tan delta (E''/E') vs. temperature. The peak of the tan delta curve is often reported as the Tg for mechanical relaxation. The steep drop in E' indicates the transition.
Visualization of Concepts
Diagram 1: QbD Workflow Integrating Tg as a CQA
(Title: QbD Workflow with Tg as a Critical Quality Attribute)
Diagram 2: Fundamental Impact of Tg on Product Stability Pathways
(Title: Tg-Dependent Product Stability Decision Pathway)
The Scientist's Toolkit: Research Reagent Solutions
Table 3: Essential Materials for Tg-Focused Pharmaceutical Research
| Item / Reagent | Function / Rationale |
|---|---|
| Polymeric Carriers (e.g., PVP-VA, HPMCAS, Soluplus) | Matrix formers for amorphous solid dispersions. Their Tg and drug-polymer interactions dictate dispersion stability. |
| Cryo/lyoprotectants (e.g., Sucrose, Trehalose) | Stabilize lyophilized proteins by forming an amorphous matrix with a high enough Tg to prevent collapse during storage. |
| Hermetic Tzero DSC Pans & Lids | Ensure an isolated environment during thermal analysis, preventing moisture loss/gain that would artifact Tg measurement. |
| Standard Reference Materials (e.g., Indium, Zinc) | For calibration of DSC temperature and enthalpy scales, ensuring accuracy and regulatory compliance of Tg data. |
| Dynamic Vapor Sorption (DVS) Instrument | Quantifies moisture sorption isotherms. Critical for understanding water's plasticizing effect (lowering Tg) on hygroscopic amorphous products. |
| Modulated DSC (mDSC) Instrument | The gold-standard for separating complex thermal events, allowing precise Tg measurement in complex systems like solid dispersions. |
This case study is framed within a broader thesis on the definition and fundamental principles of the glass transition temperature (Tg). The Tg is a critical material property for amorphous pharmaceuticals, representing the temperature at which a supercooled liquid transitions into a glassy solid. This transition demarcates a profound change in molecular mobility, thermodynamic properties, and, consequently, chemical and physical stability. Understanding the fundamental relationship between Tg, molecular mobility below Tg (in the glassy state), and long-term stability is paramount for the rational design and robust development of amorphous drug products.
Fundamental Principles: Tg, Molecular Mobility, and Stability
The physical stability of an amorphous solid dispersion (ASD) is governed by its tendency to undergo crystallization, which can compromise dissolution rate, bioavailability, and ultimately, therapeutic efficacy. The primary stabilization mechanism is kinetic, provided by the high viscosity and low molecular mobility of the glassy state. Molecular mobility encompasses both global motions (associated with viscous flow and the α-relaxation process, which is directly linked to Tg) and local motions (β-relaxations), which can persist significantly below Tg. Chemical stability, including hydrolysis and oxidation, is also influenced by molecular mobility, as diffusion of reactants and water is modulated by the rigidity of the amorphous matrix.
The "ΔT = Tg - Tstorage" rule is a foundational empirical principle. A larger positive ΔT indicates storage further below the Tg, where molecular mobility is exponentially reduced, theoretically leading to greater stability. However, the relationship is not always linear or predictable due to factors like plasticization by moisture, specific drug-polymer interactions, and the complex nature of relaxation processes in the glass.
Data Presentation: Key Case Studies and Findings
Recent literature provides quantitative evidence of the Tg-stability correlation. The following table summarizes findings from pivotal studies.
Table 1: Correlation of Tg and Physical Stability in Amorphous Systems
| Drug Substance | Polymer/System | Tg (Dry) (°C) | Tg (at RH%) (°C) | Storage Condition (T, %RH) | Stability Outcome (Time) | Key Correlation Finding | Ref. |
|---|---|---|---|---|---|---|---|
| Indomethacin | PVP-VA 64 | 78 | 45 (60% RH) | 40°C/75% RH | Crystallized (1 month) | ΔT ~ -30°C; Rapid crystallization. | [1] |
| Itraconazole | HPMC-AS | 110 | 95 (60% RH) | 40°C/75% RH | Stable (>24 months) | ΔT ~ +55°C; Maintained amorphous. | [2] |
| Celecoxib | PVP K30 | 58 | 32 (60% RH) | 25°C/60% RH | Crystallized (6 months) | ΔT ~ +7°C; Marginal stability. | [3] |
| Felodipine | PVP-VA 64 | 78 | N/A | 30°C/0% RH | Stable (>36 months) | ΔT ~ +48°C; Excellent stability. | [4] |
| Ritonavir | HPMC-AS | 105 | 70 (60% RH) | 40°C/75% RH | Crystallized (12 months) | ΔT ~ +30°C; Stabilized but eventually crystallized. | [5] |
Table 2: Correlation of Tg (and Tg - T) with Chemical Stability Metrics
| Drug Substance | System | Tg (°C) | Storage T (°C) | ΔT (Tg - T) | Degradation Rate Constant (k) | % Degradation (Time) | Ref. |
|---|---|---|---|---|---|---|---|
| Amorphous Sucrose | Pure | 70 | 40 | 30 | 2.3 x 10⁻⁷ s⁻¹ | ~25% (6 months) | [6] |
| Amorphous Sucrose | Pure | 70 | 60 | 10 | 8.1 x 10⁻⁶ s⁻¹ | ~95% (6 months) | [6] |
| Cefuroxime Axetil | PVP K30 | 85 | 40 | 45 | Low | <5% (24 months) | [7] |
| Cefuroxime Axetil | No Polymer | 45 | 40 | 5 | High | >20% (3 months) | [7] |
Experimental Protocols
Protocol for Determining Glass Transition Temperature (Tg)
Method: Differential Scanning Calorimetry (DSC)
- Sample Preparation: Precisely weigh 3-10 mg of the amorphous drug or ASD into a hermetically sealed aluminum DSC pan. A pinhole lid is used for controlled venting in moisture-sensitive studies.
- Instrument Calibration: Calibrate the DSC for temperature and enthalpy using indium and zinc standards.
- Experimental Run: Heat the sample and an empty reference pan under a nitrogen purge (50 mL/min). A typical method involves:
- Equilibrate at -20°C.
- Heat at 10°C/min to 20°C above the expected Tg.
- Data Analysis: Analyze the resulting heat flow curve. The Tg is identified as the midpoint of the step-change in heat capacity. The inflection point or onset temperature may also be reported for consistency.
Protocol for Long-Term Stability Testing of ASDs
- Sample Preparation: Manufacture ASD via spray drying or hot-melt extrusion. Characterize initial state (amorphous by XRD, Tg by DSC).
- Conditioning: Place samples in controlled stability chambers at specified ICH conditions (e.g., 25°C/60% RH, 40°C/75% RH).
- Sampling: Remove samples at predetermined time points (e.g., 0, 1, 3, 6, 12, 24, 36 months).
- Stability-Indicating Assays:
- Physical Stability: Powder X-ray Diffraction (PXRD) to detect crystallinity. mDSC to monitor Tg shifts.
- Chemical Stability: HPLC to quantify drug and degradation products.
- Performance: Dissolution testing under pharmacopeial conditions.
Visualization of Concepts and Workflows
Title: Factors Influencing Amorphous Drug Stability
Title: Stability Study & Tg Correlation Workflow
The Scientist's Toolkit: Key Research Reagent Solutions
Table 3: Essential Materials for Tg-Stability Correlation Studies
| Category | Item/Reagent | Function & Rationale |
|---|---|---|
| Polymer Carriers | Polyvinylpyrrolidone-vinyl acetate (PVP-VA) | Common matrix former. Provides moderate Tg elevation and hydrogen bonding capacity. |
| Hypromellose Acetate Succinate (HPMC-AS) | pH-dependent polymer. Often provides high Tg and strong drug-polymer interactions via hydrogen bonding. | |
| Soluplus (PVA-PEG graft copolymer) | Amphiphilic polymer for melt extrusion. Offers good plasticization resistance. | |
| Analytical Standards | Indium & Zinc (for DSC) | High-purity metals for precise temperature and enthalpy calibration of DSC. |
| Silicon powder (for XRD) | Standard for instrument alignment and calibration of diffraction angles. | |
| Stability Testing | Saturated Salt Solutions (e.g., Mg(NO₃)₂, NaCl) | Used in desiccators to maintain precise, constant relative humidity for small-scale stability studies. |
| Sample Preparation | Hermetic & Pinhole DSC Pans | For moisture-free and controlled humidity Tg measurements, respectively. |
| Characterization | Dielectric Spectroscopy (DES) Cells | For direct measurement of molecular mobility (α and β relaxations) as a function of temperature and humidity. |
Conclusion
The glass transition temperature (Tg) is far more than a singular thermal event; it is a fundamental descriptor of amorphous material behavior with profound implications across pharmaceutical science. From foundational theories defining molecular mobility to its validation as a Critical Quality Attribute, Tg provides an essential framework for rational formulation design. Mastering its measurement and interpretation enables scientists to predict and control physical stability, optimize manufacturing processes like lyophilization and hot-melt extrusion, and ultimately ensure drug product performance and shelf-life. Future directions point towards advanced predictive modeling of Tg, high-throughput screening of polymer matrices, and a deeper integration of Tg with other material-spatial heterogeneity metrics (like cooperativity length) to achieve next-generation, stable amorphous pharmaceuticals and biologics.