Life Cycle Assessment of Biopolymers: A Critical Analysis for Sustainable Biomedical Materials
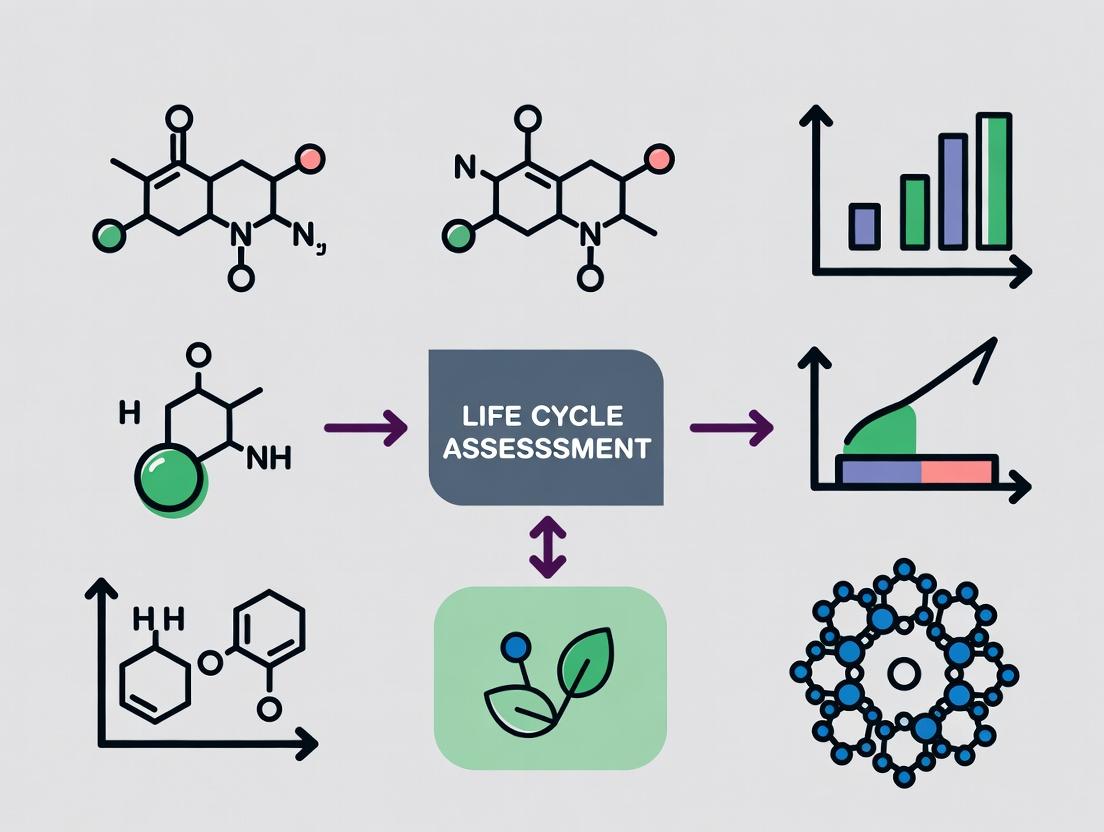
This comprehensive review provides researchers, scientists, and drug development professionals with a systematic framework for conducting and interpreting Life Cycle Assessments (LCA) of biopolymer production.
Life Cycle Assessment of Biopolymers: A Critical Analysis for Sustainable Biomedical Materials
Abstract
This comprehensive review provides researchers, scientists, and drug development professionals with a systematic framework for conducting and interpreting Life Cycle Assessments (LCA) of biopolymer production. The article explores the foundational principles of LCA for biopolymers, details key methodological standards and data sources, addresses common challenges in data acquisition and system boundary definition, and provides comparative analyses of major biopolymer families. By synthesizing the latest research and ISO standards (14040/14044), it aims to guide the selection and development of environmentally sustainable biopolymers for biomedical applications, from drug delivery systems to tissue engineering scaffolds.
What is LCA for Biopolymers? Defining Scope, Goals, and Critical System Boundaries
Life Cycle Assessment (LCA) is a standardized, systematic methodology (ISO 14040/14044) for quantifying the potential environmental impacts associated with all stages of a product's life. Within the context of biopolymer production research, LCA is indispensable for evaluating the environmental footprint from raw material extraction to end-of-life, providing a comparative basis against conventional polymers and guiding sustainable process optimization.
Foundational LCA Principles: Goal & Scope, Inventory, Impact, Interpretation
An LCA is structured in four interlinked phases:
- Goal and Scope Definition: Explicitly states the study's purpose, functional unit (e.g., 1 kg of polylactic acid (PLA)), system boundaries, and intended audience.
- Life Cycle Inventory (LCI): Involves the data-intensive collection and calculation of all relevant inputs (energy, water, raw materials) and outputs (emissions, waste) for each process within the defined boundaries.
- Life Cycle Impact Assessment (LCIA): Converts inventory data into potential environmental impact scores (e.g., global warming potential in kg CO₂-eq, eutrophication potential).
- Interpretation: Evaluates results, checks sensitivity, and provides conclusions and recommendations consistent with the goal and scope.
Diagram 1: The Four Interlinked Phases of LCA
System Boundary Models: Cradle-to-Grave vs. Cradle-to-Gate
The choice of system boundary is critical and defines the LCA's comprehensiveness. Two primary models are used, especially in chemical and biopolymer research.
Cradle-to-Gate
This is a partial LCA that assesses a product's life from raw material acquisition ("cradle") up to the factory "gate"—the point where the product is ready for dispatch. It excludes use-phase and end-of-life treatment. This model is typical for environmental product declarations (EPDs) of intermediate goods like polymer resins.
Cradle-to-Grave
This is a full LCA encompassing the entire life cycle: raw material extraction, material processing, product manufacture, distribution, use, and final disposal or recycling ("grave"). It is essential for understanding the total environmental burden of a final product, such as a bioplastic packaging item or medical device.
Diagram 2: System Boundary Comparison for LCA Models
Quantitative Comparison of LCA Boundaries in Biopolymer Studies Table 1: Typical processes and data requirements for LCA of biopolymer production (e.g., Polylactic Acid - PLA).
| Life Cycle Stage | Cradle-to-Gate Assessment | Cradle-to-Grave Assessment |
|---|---|---|
| Raw Material (Corn) | Cultivation: Fertilizer, pesticide, water, diesel use. Transportation to processing plant. | Identical to cradle-to-gate. |
| Biopolymer Production | Starch extraction, fermentation to lactic acid, polymerization to PLA. Inputs: Enzymes, yeast, process energy (heat/electricity), water. Outputs: Waste. | Identical to cradle-to-gate. |
| Product Manufacturing | Often excluded. May include compounding and pelletizing. | Converting PLA resin into final product (e.g., film, fiber). Energy and material inputs for molding/extrusion. |
| Distribution & Transport | Usually excluded or limited to gate-to-gate transport. | Transport of final product to customer/retailer. Consideration of packaging materials. |
| Use Phase | Excluded. | Included if relevant (e.g., energy for sterilization of a medical device, potential release of microplastics). For inert packaging, may be negligible. |
| End-of-Life (EoL) | Excluded. | Critical stage. Includes scenarios: Industrial composting (CO₂, CH₄), mechanical recycling (energy), chemical recycling (chemical inputs), incineration (emissions), landfill (CH₄ leakage). Requires EoL allocation. |
Experimental Protocols for LCA in Biopolymer Research
Protocol 1: Conducting a Cradle-to-Gate LCA for Novel Biopolymer Synthesis
- Goal Definition: E.g., To determine the global warming potential (GWP) of 1 kg of novel Polyhydroxyalkanoate (PHA) from pilot-scale bioreactor production for internal R&D benchmarking.
- Scope & Inventory:
- System Boundary: Cultivation of feedstock bacteria (including growth medium preparation) -> Fermentation/PHA accumulation -> Biomass harvesting -> PHA extraction/purification -> Drying.
- Data Collection: Primary data from lab/pilot logs: exact masses of glucose, salts, nutrients; electricity consumption of bioreactor, centrifuge, lyophilizer; volumes of solvents (e.g., chloroform) for extraction, with recycling rates. Secondary data from databases (e.g., Ecoinvent, GaBi) for background processes (electricity grid mix, chemical production).
- Impact Assessment: Use LCIA method (e.g., ReCiPe 2016 Midpoint) to calculate impact categories (GWP, freshwater eutrophication).
- Interpretation: Compare impact profile to commercial PLA or PET from literature using same LCIA method. Perform sensitivity analysis on key parameters (e.g., source of electricity).
Protocol 2: Comparative Cradle-to-Grave LCA of Biopolymer vs. Conventional Polymer
- Goal Definition: E.g., To compare the environmental performance of a starch-based bioplastic film versus a conventional Low-Density Polyethylene (LDPE) film for single-use packaging.
- Scope & Inventory:
- Functional Unit: 1 square meter of film with equivalent tensile strength and barrier properties.
- System Boundary: Full cradle-to-grave.
- Data Collection:
- Production: As per Protocol 1 for biopolymer, plus film extrusion data. For LDPE: naphtha cracking, polymerization data from databases.
- Use: Assume identical transport and no in-use impacts.
- End-of-Life: Model multiple scenarios: A) 100% landfill, B) 100% incineration with energy recovery, C) Industrial composting (biopolymer only), D) Mechanical recycling (LDPE only). Use landfill gas collection models and composting emission factors from literature.
- Impact Assessment: Calculate a range of impacts (GWP, water use, land use) for each EoL scenario.
- Interpretation: Present results in a scenario-based table. The conclusion is often dependent on the chosen EoL pathway, highlighting the importance of waste management infrastructure.
The Scientist's Toolkit: Essential Reagents & Materials for Biopolymer LCA Research
Table 2: Key research reagents, software, and data sources for conducting LCA on biopolymer production.
| Item / Solution | Function in Biopolymer LCA Research |
|---|---|
| Primary Data Collection Tools | Lab notebooks, process mass balances, energy meters (on bioreactors, dryers), solvent recovery logs. Essential for creating accurate, site-specific Life Cycle Inventory (LCI). |
| LCA Software (e.g., OpenLCA, SimaPro, GaBi) | Software platforms used to model the product system, manage inventory data, perform LCIA calculations, and generate results and graphs. |
| Background LCI Databases (e.g., Ecoinvent) | Commercial/public databases containing pre-calculated inventory data for thousands of generic processes (electricity, chemicals, transport). Crucial for filling data gaps in the supply chain. |
| LCIA Methodologies (e.g., ReCiPe, EF 3.0) | Standardized sets of characterization factors that translate LCI flows (e.g., kg of methane emitted) into impact category scores (e.g., kg CO₂-equivalents for GWP). |
| Allocation Procedures | Mathematical methods (mass, economic, energy-based) to partition environmental burdens between co-products (e.g., distiller's grains in corn ethanol production). A critical methodological choice. |
| Sensitivity & Uncertainty Analysis Tools | Functions within LCA software or external statistical packages (R, Python) used to test how variations in key input data (e.g., yield, energy mix) affect the final results. |
Why LCA is Essential for Evaluating "Green" Claims of Biopolymers
Within the broader thesis on Life Cycle Assessment (LCA) of biopolymer production, this document establishes the imperative for rigorous, standardized LCA to validate environmental claims. Biopolymers, such as polylactic acid (PLA), polyhydroxyalkanoates (PHAs), and starch-based plastics, are frequently marketed as sustainable alternatives to conventional fossil-based polymers. However, claims of "biodegradability," "carbon neutrality," or "reduced environmental impact" are often based on narrow system boundaries or selective metrics. A full cradle-to-grave LCA is the only scientifically defensible methodology to quantify net environmental trade-offs, including global warming potential (GWP), eutrophication, land use change (LUC), and water consumption. For researchers and drug development professionals, this is critical for informed material selection in applications like medical devices and controlled-release drug matrices.
Core LCA Methodologies: ISO Standards and Experimental Frameworks
Life Cycle Assessment is governed by ISO 14040 and 14044 standards, which define four iterative phases:
Phase 1: Goal and Scope Definition
- Objective: Quantify the environmental profile of biopolymer X vs. conventional polymer Y for a defined functional unit (e.g., 1 kg of packaging film or 1000 sterile medical vials).
- System Boundary: Must include all stages:
- Cradle-to-Gate: Raw material extraction (e.g., corn cultivation, sugarcane harvesting), biomass processing, monomer synthesis (e.g., lactic acid fermentation), polymerization.
- Cradle-to-Grave: Adds distribution, use phase, and end-of-life (industrial composting, anaerobic digestion, landfill, recycling).
- Allocation Procedures: Critical for multi-output processes (e.g., a corn biorefinery producing starch for PLA, oil, and animal feed). Mass, energy, or economic allocation must be explicitly stated and justified.
Phase 2: Life Cycle Inventory (LCI) Analysis This phase involves experimental data collection or sourcing from validated databases (e.g., Ecoinvent, USDA).
Detailed Experimental Protocol for Key Inventory Data Points:
Protocol 1: Fermentation Yield Optimization for PHA Production
- Objective: Determine mass and energy inputs per kg of PHA produced using Cupriavidus necator.
- Materials: Defined mineral salt medium, purified glycerol or fatty acids as carbon source, seed culture bioreactor, production-scale fermenter, centrifugation equipment, lyophilizer.
- Method:
- Inoculate 5L seed bioreactor and grow to late exponential phase.
- Transfer to 50L production bioreactor under nitrogen-limiting conditions to induce PHA synthesis.
- Monitor dissolved O₂, pH, substrate concentration hourly.
- Harvest cells via continuous centrifugation at 12,000 x g.
- Lyophilize biomass and extract PHA using Soxhlet extraction with chloroform (for 6 hours).
- Purify and weigh polymer. Calculate yield (g PHA/g substrate).
- Precisely meter and record all electricity (for agitation, sterilization, cooling), steam, and water inputs.
Protocol 2: Soil Biodegradation Kinetics of PLA under Controlled Conditions
- Objective: Measure CO₂ evolution to determine ultimate biodegradability percentage as per ASTM D5988.
- Materials: PLA film samples (1cm²), mature compost soil, respirometric flasks, NaOH traps, titration setup.
- Method:
- Place 10g test material and 200g soil in respirometer flask. Maintain at 58°C ± 2°C and 50% moisture.
- Flow CO₂-free air through system. Trap evolved CO₂ in 0.1N NaOH solutions.
- Titrate NaOH traps with 0.1N HCl at defined intervals (days 1, 3, 7, 14, 28, etc.).
- Calculate cumulative CO₂ evolution. Compare to theoretical CO₂ maximum (based on carbon content of sample).
- Run cellulose (positive control) and polyethylene (negative control) concurrently.
Phase 3: Life Cycle Impact Assessment (LCIA) Convert inventory data into impact category indicators using characterization models (e.g., ReCiPe, TRACI).
Phase 4: Interpretation Analyze results, perform sensitivity analysis (e.g., on allocation choice or energy grid mix), and draw conclusions.
Quantitative Data: The Inherent Trade-offs of Biopolymers
The following tables synthesize recent LCA data, highlighting that "green" claims are not universally valid and depend on specific context and impact category.
Table 1: Comparative Global Warming Potential (GWP) for Selected Polymers (Cradle-to-Grave)
| Polymer Type | GWP (kg CO₂ eq/kg polymer)* | Key Contributing Stages | Critical Notes |
|---|---|---|---|
| PET (fossil) | 3.0 - 3.6 | Raw material extraction, polymerization | Baseline for comparison. |
| PLA (corn, US) | 1.5 - 3.0 | Fertilizer production, fermentation energy | Highly sensitive to grid electricity source. Credits for carbon sequestration in biomass often applied. |
| PLA (sugarcane, BR) | 0.8 - 1.5 | Agriculture, transport | Bagasse-fueled energy significantly reduces impact. |
| PHA (from glycerol) | 2.5 - 4.0 | Chemical processing of glycerol, fermentation | High energy demand for downstream processing (extraction). |
| Starch-Blend | 1.8 - 2.5 | Fertilizer production, blending with synthetic copolymers | End-of-life often incineration. |
Ranges reflect variations in system boundaries, allocation methods, and regional energy mixes (Source: Recent meta-analyses, 2022-2024).
Table 2: Impact Category Trade-offs: PLA vs. PET (per kg)
| Impact Category | PLA (Corn-based) | PET (Fossil-based) | Interpretation |
|---|---|---|---|
| Abiotic Depletion (fossil) | Lower (~80% reduction) | High | PLA reduces fossil resource use. |
| Eutrophication Potential | Higher (2-3x increase) | Lower | Primarily from agricultural runoff of nitrogen/phosphorus fertilizers. |
| Acidification Potential | Higher (~50% increase) | Lower | Linked to fertilizer application and ammonia emissions. |
| Land Use | Significantly Higher | Negligible | Direct land occupation for feedstock cultivation; potential indirect land use change (iLUC) is a major, debated factor. |
Visualizing LCA Workflows and System Complexity
Title: LCA Phases and Biopolymer System Boundary
Title: LCA Reveals Impact Trade-offs and Uncertainties
The Scientist's Toolkit: Essential Research Reagent Solutions for Biopolymer LCA
| Item/Category | Function in Biopolymer LCA Research | Example/Note |
|---|---|---|
| Defined Culture Media & Substrates | For reproducible fermentation studies to generate primary LCI data on monomer (e.g., lactic acid, hydroxyalkanoates) production yields and nutrient inputs. | Minimal Salt Medium for PHA production; purified vs. waste carbon sources. |
| Respirometric Systems | To experimentally determine biodegradation kinetics under controlled conditions (soil, marine, compost), a critical data point for end-of-life modeling. | OECD 301B, ASTM D5988 compliant systems. |
| Soxhlet Extractors & Solvents | For polymer recovery and purification from biomass (e.g., PHA from cell mass) to determine energy and chemical inputs for downstream processing. | Chloroform, acetone, methanol for extraction/purification. |
| Elemental & Isotopic Analyzers | To determine carbon content (for biodegradation calculations) and for carbon-14 analysis to distinguish biogenic vs. fossil carbon in complex blends. | CHNS Analyzer, ¹⁴C Scintillation Counting. |
| LCA Software & Databases | To model complex life cycles, apply impact assessment methods, and access background data (energy, chemicals, transport). | SimaPro, GaBi, openLCA; Ecoinvent, Agri-Footprint databases. |
| Soil & Compost Standards | Standardized materials for biodegradation testing to ensure comparability and reproducibility of results across studies. | Certified mature compost per ISO 14855. |
Robust LCA is non-negotiable for moving beyond marketing-driven "green" claims to a genuine, quantified understanding of biopolymer sustainability. The research underscores that benefits in fossil resource depletion and sometimes GWP can be counterbalanced by increased eutrophication, acidification, and land use impacts. For scientists and drug development professionals, this detailed analysis provides the evidence base for selecting biomaterials that offer true environmental advantages for specific applications, while directing research towards mitigating hotspots in biopolymer production pathways. Future work must prioritize primary data generation, standardization of end-of-life scenarios, and improved modeling of indirect land use change.
Life cycle assessment (LCA) is an indispensable methodology for quantifying the environmental impacts of biopolymer production across its entire value chain. The choice of feedstock—agricultural crops, microbial fermentation substrates, or waste streams—profoundly influences key LCA metrics such as global warming potential (GWP), eutrophication, land use, and energy demand. This technical guide provides a comparative analysis of these three primary feedstock categories, detailing their properties, experimental protocols for characterization, and their implications for sustainable polymer research and development.
Feedstock Characterization and Comparative Data
The selection of feedstock dictates downstream processing, polymer properties, and overall environmental footprint. Quantitative data for common feedstocks are summarized below.
Table 1: Key Characteristics of Primary Biopolymer Feedstocks
| Feedstock Category | Specific Feedstock | Typical Carbohydrate/ Carbon Content (%) | LCA Impact (GWP kg CO2-eq/kg polymer)* | Key Biopolymer(s) Produced | Major LCA Hotspots |
|---|---|---|---|---|---|
| Agricultural Crops | Corn Starch | ~73% starch | 2.5 - 4.1 | Polylactic Acid (PLA), Starch-based plastics | Fertilizer production, farming operations, land use change |
| Sugarcane | ~13% sucrose (in juice) | 1.2 - 2.8 | Polyhydroxyalkanoates (PHA), Bio-PET | Agricultural stage, processing energy | |
| Microbial Fermentation | Glucose Syrup | >95% glucose | 3.0 - 5.5 (cradle-to-gate) | PLA, PHA, Succinic Acid polymers | Feedstock cultivation, bioreactor energy, downstream processing |
| Vegetable Oils | ~100% triglycerides | 2.8 - 4.5 | Medium-chain-length PHA | Oil crop cultivation, sterilization energy | |
| Waste Streams | Lignocellulosic Biomass (e.g., corn stover) | ~40% cellulose, ~25% hemicellulose | 0.5 - 2.0 | Cellulose acetate, PLA (via fermented sugars) | Pre-treatment chemical/energy, hydrolysis efficiency |
| Waste Cooking Oil | ~100% triglycerides | 1.0 - 2.5 | PHA, Bio-based polyols | Collection/transport, purification | |
| Cheese Whey Permeate | ~5% lactose | -1.5 - 1.0 | PHA, Bacterial cellulose | Transport, nutrient supplementation |
Ranges are indicative and highly dependent on system boundaries, allocation methods, and process efficiency. *Negative GWP potential is possible with avoided burdens from waste treatment.
Detailed Experimental Protocols for Feedstock Analysis
Protocol: Compositional Analysis of Lignocellulosic Waste Feedstocks (NREL/TP-510-42618)
This standard protocol determines the structural carbohydrates, lignin, and ash content, critical for designing hydrolysis and fermentation processes.
- Sample Preparation: Air-dry biomass, mill to pass a 20-mesh screen, and extract with water and ethanol.
- Acid Hydrolysis: In a two-step process, first treat 300 mg of extractive-free biomass with 72% w/w sulfuric acid at 30°C for 1 hour. Then dilute to 4% w/w acid concentration and autoclave at 121°C for 1 hour.
- Quantification: Analyze the hydrolysate via High-Performance Liquid Chromatography (HPLC) with a refractive index detector (for sugars: glucose, xylose, arabinose) and a UV detector (for acid-soluble lignin). Ash content is determined by combustion at 575°C. Klason lignin is the residue after hydrolysis.
Protocol: Microbial Production of PHA from Waste Cooking Oil
This method outlines PHA synthesis using Pseudomonas putida KT2440.
- Feedstock Pretreatment: Filter waste cooking oil to remove particulates. For P. putida, no transesterification is required.
- Fermentation: Inoculate a mineral salts medium (e.g., M9) with a 2% v/v overnight culture. Add sterilized waste oil (1-2% v/v) as the sole carbon source. Ferment in a bioreactor at 30°C, pH 7.0, with vigorous aeration (≥1 vvm) for 48-72 hours.
- PHA Extraction & Quantification: Harvest cells by centrifugation. Lyophilize and weigh for biomass. For PHA quantification, perform methanolysis of 5-10 mg dry biomass with chloroform, methanol, and sulfuric acid (85:15:0.3 v/v/v) at 100°C for 2-4 hours. Analyze methyl esters of hydroxylalkanoic acids via Gas Chromatography (GC) with a flame ionization detector, using benzoic acid as an internal standard.
Visualizations
Feedstock to Biopolymer LCA System Boundary
Experimental Workflow for Waste Feedstock Valorization
The Scientist's Toolkit: Research Reagent Solutions
Table 2: Essential Materials for Biopolymer Feedstock Research
| Item | Function | Example Supplier/Product |
|---|---|---|
| Neutral Detergent Fiber (NDF) Solution | Determines hemicellulose, cellulose, and lignin in biomass via sequential fiber analysis. | ANKOM Technology A200, Sigma-Aldrich D2168 |
| Aminex HPX-87H HPLC Column | Standard column for separation and quantification of sugar monomers (glucose, xylose) and fermentation inhibitors (HMF, furfural) in hydrolysates. | Bio-Rad 125-0140 |
| Mineral Salts Medium (MSM) Kit | Defined medium for microbial fermentation studies, ensuring reproducible PHA or other biopolymer production from test feedstocks. | HiMedia M201, ATCC Medium 2034 |
| PHA Standard Kit | A set of authenticated polyhydroxyalkanoate (e.g., PHB, PHBV) standards for calibration of GC, HPLC, or FTIR quantification methods. | Sigma-Aldrich 36,359, Polysciences 06054 |
| Folin-Ciocalteu Reagent | Used in colorimetric assays to determine total phenolic content, relevant for assessing lignin-derived inhibitors in lignocellulosic hydrolysates. | Sigma-Aldrich F9252 |
| Cellulase/ Hemicellulase Enzyme Cocktail | Standardized enzyme mix for saccharification experiments to evaluate the digestibility of pretreated biomass feedstocks. | Sigma-Aldrich C2730, Novozymes Cellic CTec2 |
Within a broader thesis on the Life Cycle Assessment (LCA) of biopolymer production for biomedical applications, the functional unit is the cornerstone. It defines the quantified performance of a product system for which inputs and outputs are assessed. Selecting an incorrect or ambiguous functional unit fundamentally invalidates the comparison between, for example, a novel bio-based polyhydroxyalkanoate (PHA) scaffold and a conventional petroleum-based polylactic acid (PLA) or polycaprolactone (PCL) one. This guide details the technical definition, application, and experimental basis for establishing robust functional units in biomedical materials LCA.
Core Principles and Definitions
- Functional Unit: A precisely defined measure of the function(s) or service(s) provided by the product system. It answers "What?" and "How much?" and "For how long?" and "To what quality?"
- Reference Flow: The amount of product(s) needed to fulfill the functional unit. This is the physical quantity linking the abstract functional unit to the inventory data.
Quantitative Data Presentation: Common Functional Units in Biomedical LCA
Table 1: Comparative Functional Units for Selected Biomedical Applications
| Application | Candidate Material A | Candidate Material B | Appropriate Functional Unit | Common Pitfall (Incorrect Unit) |
|---|---|---|---|---|
| Bone Tissue Scaffold | PHA-based porous scaffold | β-Tricalcium Phosphate (β-TCP) ceramic scaffold | "Provide mechanical support and osteoconduction for a 3 cm³ critical-size bone defect in a murine model, achieving 80% bone ingrowth and a compressive strength of 5 MPa at 12 weeks post-implantation." | "1 kg of scaffold material" |
| Drug Delivery Nanoparticle | PLA-PEG copolymer nanoparticle | Chitosan-based nanoparticle | "Encapsulate and deliver 150 mg of therapeutic payload (e.g., Doxorubicin) to a specific tumor site, achieving a 70% reduction in tumor volume over a 28-day treatment cycle with less than 10% premature release." | "1 gram of nanoparticle formulation" |
| Absorbable Suture | PLA monofilament suture | Silk fibroin multifilament suture | "Appose wound margins of a 5 cm incisional skin wound in a standardized model, maintaining tensile strength above 0.5 N for a minimum of 14 days, with complete absorption and tissue remodeling within 90 days." | "1 meter of suture" |
Table 2: Key Performance Metrics Informing Functional Unit Definition
| Metric Category | Specific Parameters | Typical Measurement Methods |
|---|---|---|
| Structural/Mechanical | Tensile/Compressive Strength, Modulus, Porosity, Degradation Rate (in vitro/in vivo) | ASTM F2150, ISO 13781, Micro-CT, SEM, Mass Loss Analysis |
| Biological Performance | Cell Viability (%), Osteogenic Differentiation (ALP activity, OCN expression), Hemocompatibility (Hemolysis %), Drug Release Kinetics | ISO 10993-5, ISO 10993-4, qPCR, ELISA, UV-Vis Spectrophotometry |
| Functional Efficacy | Bone Volume/Tissue Volume (BV/TV), Tumor Growth Inhibition, Wound Burst Pressure, Time to Complete Healing | Histomorphometry, Caliper Measurements, Biomechanical Testing, Clinical Scoring |
Experimental Protocols for Functional Unit Parameterization
Protocol 4.1: In Vitro Degradation Kinetics for Defining Service Duration Objective: To determine mass loss and molecular weight change of a biopolymer to inform the "for how long" aspect of the functional unit.
- Sample Preparation: Prepare sterile, pre-weighed (M₀) polymer discs (e.g., 10mm diameter x 2mm thick). Precisely measure initial molecular weight (Mₙ₀) via GPC.
- Immersion: Immerse samples (n=5 per time point) in 50 mL of phosphate-buffered saline (PBS, pH 7.4) or simulated body fluid (SBF) at 37°C under gentle agitation.
- Sampling: Retrieve samples at predetermined intervals (e.g., 1, 4, 12, 26, 52 weeks).
- Analysis: Rinse, dry under vacuum, and weigh (Mₜ). Calculate mass loss: ((M₀ - Mₜ)/M₀)*100%. Perform GPC to determine Mₙₜ.
- Data Modeling: Fit degradation data to kinetic models (e.g., first-order) to predict functional service life.
Protocol 4.2: In Vivo Osteogenic Efficacy for Bone Scaffold Functional Unit Objective: To quantify bone ingrowth for a defect-filling scaffold.
- Animal Model: Establish critical-size defect (e.g., 8mm calvarial) in rodent model (IACUC approved).
- Implantation: Randomly assign animals to groups: Test Scaffold A (PHA), Test Scaffold B (TCP), Empty Defect Control (n=8/group).
- Endpoint: Euthanize at 12 weeks.
- Analysis: Excise defect site, fix, and scan via high-resolution micro-CT. Reconstruct 3D images.
- Quantification: Using analysis software (e.g., CTAn), define a Volume of Interest (VOI) encompassing the original defect. Calculate Bone Volume/Total Volume (BV/TV) within the scaffold pores and adjacent area.
- Statistical Comparison: Compare BV/TV between groups using ANOVA. The scaffold enabling BV/TV ≥ target threshold (e.g., 40%) fulfills the functional unit.
Mandatory Visualizations
Diagram 1: Functional Unit Drives LCA (78 chars)
Diagram 2: FU Definition Workflow (65 chars)
The Scientist's Toolkit: Key Research Reagent Solutions
Table 3: Essential Reagents for Parameterizing Functional Units
| Reagent / Material | Primary Function in Context of FU Definition | Example Supplier / Catalog |
|---|---|---|
| Simulated Body Fluid (SBF) | In vitro assessment of bioactivity (e.g., apatite formation on biomaterials) and degradation kinetics. | Sigma-Aldrich, SBF Prepared per Kokubo protocol |
| AlamarBlue or MTS Assay Kit | Quantification of cell viability and proliferation on material surfaces to assess cytocompatibility. | Thermo Fisher Scientific, DAL1025 |
| Osteogenic Differentiation Media Kit | Induce and assess osteogenic differentiation of stem cells on scaffolds (e.g., measuring ALP activity). | STEMCELL Technologies, 05210 |
| Rat tail Collagen, Type I | Gold-standard control or component for coating in cell-seeding experiments for tissue engineering. | Corning, 354236 |
| Poly(lactic-co-glycolic acid) (PLGA) | Benchmark biodegradable polymer for comparative performance studies (e.g., drug release). | Evonik, Resomer RG 503H |
| Micro-CT Calibration Phantom | Essential for quantitative, accurate bone morphometry (BV/TV) in small animal models. | Bruker, Morphology Phantom |
| GPC/SEC Standards (Polystyrene, PMMA) | Determine molecular weight distribution and change during degradation studies. | Agilent Technologies, PL2010-0201 |
Within Life Cycle Assessment (LCA) research for biopolymer production, establishing precise system boundaries is the foundational step that determines the scope, validity, and comparability of results. This technical guide delineates the critical boundaries across the agriculture, processing, manufacturing, and end-of-life stages, providing a framework for researchers to conduct consistent and comprehensive assessments.
Defining the Core Life Cycle Stages
Agricultural Production (Cradle)
This boundary encompasses all activities from land preparation to the harvest and initial transport of biomass feedstocks (e.g., corn, sugarcane, cellulose).
Key Inclusions:
- Cultivation inputs: Seeds, fertilizers, pesticides, irrigation water.
- Direct agricultural operations: Tillage, planting, harvesting.
- Indirect inputs: Fertilizer production, machinery manufacture and fuel combustion.
- Direct land-use change (dLUC) and potential indirect land-use change (iLUC) emissions.
- Soil emission factors (N₂O, CO₂).
Key Exclusions (Common Cut-offs):
- Capital goods infrastructure with long lifetimes (e.g., tractor manufacturing buildings).
- Human labor and administrative activities.
Quantitative Data Summary: Table 1: Representative Agricultural Input Data for Common Biopolymer Feedstocks (per hectare per year)
| Feedstock | Yield (tonnes/ha) | N-Fertilizer (kg N/ha) | Irrigation Water (m³/ha) | Direct Energy (GJ/ha) | Reference |
|---|---|---|---|---|---|
| Corn (Grain) | 9.5 - 11.5 | 140 - 180 | 5000 - 7000 | 8 - 12 | USDA ERS, 2023 |
| Sugarcane | 65 - 85 | 100 - 150 | 1500 - 3000 (Rainfed) | 6 - 9 | FAOStat, 2023 |
| Switchgrass | 10 - 15 | 0 - 50 | Minimal | 2 - 4 | Bioenergy Research, 2023 |
Feedstock Processing & Monomer Production
This stage converts raw biomass into purifiable monomers (e.g., lactic acid, succinic acid, hydroxyalkanoates).
Key Inclusions:
- Pre-treatment: Milling, hydrolysis.
- Fermentation/Bio-conversion: Bioreactor operations, nutrient media, sterilization.
- Primary Separation: Filtration, centrifugation.
- Monomer Purification: Distillation, crystallization, chromatography.
- On-site utilities: Steam, electricity, process water, wastewater treatment.
Experimental Protocol for Laboratory-Scale Fermentation Yield Analysis:
- Inoculum Preparation: Activate lyophilized microbial strain (e.g., Lactobacillus sp. for PLA) in 100 mL MRS broth at 37°C for 24h.
- Bioreactor Setup: Inoculate 5L bioreactor containing defined media (carbon source from feedstock hydrolysate, yeast extract, salts) to an initial OD600 of 0.1.
- Process Control: Maintain pH at 6.5 via automatic addition of 5M NaOH. Control temperature at 37°C. Agitation at 200 rpm, with N₂ sparging for anaerobic conditions.
- Monitoring: Sample hourly for 48h. Analyze substrate concentration via HPLC-RID, product titer via GC-MS, and cell density via spectrophotometry.
- Calculation: Determine yield (Yp/s) as g product per g substrate consumed.
Biopolymer Manufacturing & Synthesis
This boundary covers the polymerization and finishing of the final biopolymer resin.
Key Inclusions:
- Polymerization: Chemical catalysis (e.g., ring-opening polymerization for PLA), or biological synthesis (PHA accumulation).
- Compounding & Pelletization: Additive incorporation, extrusion, cooling.
- Energy for synthesis reactors and extrusion lines.
- Emissions from catalysts or solvents (e.g., tin-octoate, chloroform).
- Off-spec material recycling loops within the plant gate.
Research Reagent Solutions for Polymerization:
| Reagent/Material | Function | Key Supplier Example |
|---|---|---|
| Tin(II) 2-ethylhexanoate (Sn(Oct)₂) | Catalyst for ROP of lactide | Sigma-Aldrich |
| 1,5,7-Triazabicyclo[4.4.0]dec-5-ene (TBD) | Organocatalyst for green polymerization | TCI Chemicals |
| Chloroform & Chlorinated Solvents | Solvent for PHA extraction & solution casting | VWR International |
| Molecular Sieves (3Å) | Monomer drying to prevent unwanted hydrolysis | Fisher Scientific |
| High-Purity Lactide Monomer | Precursor for high molecular weight PLA | Corbion Purac |
End-of-Life (EoL)
This module models the fate of the biopolymer product after its useful life. A circular approach requires parallel assessment of all plausible pathways.
Key Inclusions:
- Collection, sorting, and transport to EoL facility.
- Mechanical Recycling: Shredding, washing, re-pelletization (including quality loss).
- Organic Recycling: Industrial composting (ASTM D6400) or anaerobic digestion conditions (temperature, humidity, microbial consortia).
- Chemical Recycling: Depolymerization (hydrolysis, enzymatic digestion) back to monomers.
- Incineration with Energy Recovery: Calorific value and emissions profile.
- Landfill: Modeled degradation kinetics and methane capture efficiency.
Experimental Protocol for Aerobic Biodegradation in Compost:
- Material Preparation: Cut test material into 10x10mm pieces. Dry to constant weight.
- Compost Medium: Use mature, sieved (<10mm) compost meeting ISO 14855 criteria (e.g., 46% moisture, C/N ratio 20-25).
- Reactor Setup: Mix 100g (dry weight) compost with 10g test material in a 500mL respirometer flask. Include positive control (cellulose) and negative control (PE).
- Incubation: Maintain at 58°C ±2°C in a thermostatic chamber. Aerate with CO₂-free air at a constant rate (e.g., 50 mL/min).
- Measurement: Monitor CO₂ evolution in the exhaust gas via NDIR detector weekly for 90-180 days.
- Calculation: Biodegradation (%) = (CO₂ from test material – CO₂ from negative control) / Theoretical CO₂ of material * 100.
Critical Boundary Decisions & Modeling
Allocation: Multi-output processes (e.g., corn wet mill producing starch, oil, gluten) require mass, economic, or system expansion allocation. The ISO 14044 hierarchy must be applied and justified.
Cut-off Criteria: Typically, flows contributing <1% of total mass or energy input, or <5% of total environmental impact, can be excluded, provided their cumulative omission is <5%.
Technology Representativeness: Data should reflect the intended technology scenario: current average, best available, or emerging (e.g., electrochemical purification).
System Diagrams
Diagram 1: Core LCA System Boundary Model
Diagram 2: ISO 14044 LCA Phases & Iteration
How to Conduct a Biopolymer LCA: Standards, Data Inventories, and Impact Categories
Within the thesis on Life cycle assessment of biopolymer production research, the application of a standardized, rigorous methodological framework is paramount. The ISO 14040 (Principles and Framework) and ISO 14044 (Requirements and Guidelines) standards provide the indispensable, internationally recognized procedural backbone. For researchers and drug development professionals evaluating biopolymers (e.g., polyhydroxyalkanoates, polylactic acid) for applications such as medical devices or controlled-release drug matrices, this framework ensures that comparative LCA results are scientifically defensible, reproducible, and decision-relevant. This guide details the four-phase methodology with specific protocols for biopolymer systems.
The Four-Phase Methodology: A Technical Guide
Phase 1: Goal and Scope Definition
This phase establishes the study's purpose, boundaries, and granularity, determining all subsequent steps.
- Goal: Must explicitly state the intended application, reasons for carrying out the study, intended audience, and whether results are intended for comparative assertions disclosed to the public.
- Scope: Must comprehensively define:
- Functional Unit (FU): The quantified performance of the product system for use as a reference unit (e.g., "1 kg of purified biopolymer with 99.5% purity for implantable medical device fabrication").
- System Boundary: Specifies included unit processes. For biopolymer LCA, a cradle-to-gate or cradle-to-grave boundary is typical.
- Allocation Procedures: Critical for multi-output biorefinery processes (e.g., lignocellulosic feedstocks producing biopolymer, bioenergy, and chemicals). The hierarchy per ISO 14044 is: 1) Subdivision of processes, 2) System expansion, 3) Allocation based on physical relationships (e.g., mass, energy), 4) Allocation based on economic value.
- Impact Assessment Methodology & Interpretation Methodologies.
- Data Quality Requirements: Temporal, geographical, and technological representativeness.
- Critical Review Needs: If for comparative public disclosure, an independent critical review panel is mandatory.
Table 1: Exemplary Scope Definition for Polylactic Acid (PLA) vs. Conventional Polymer LCA
| Scope Element | Description for Biopolymer (PLA) Case Study |
|---|---|
| Functional Unit | 1 kg of polymer resin, pelletized and ready for injection molding, with equivalent tensile strength (>60 MPa) and melt flow index. |
| System Boundary | Cradle-to-Gate with optional end-of-life module: Corn cultivation → Starch processing → Glucose fermentation → Lactide purification → Polymerization → Pelletizing. |
| Allocation | System Expansion applied for corn stover co-product; displacement credit for avoided animal feed production. |
| Data Quality | Foreground data: Primary data from pilot plant (2021-2023). Background data: Ecoinvent v3.9, US-EI electricity mix. |
| Impact Categories | Global Warming Potential (GWP100), Fossil Resource Scarcity, Land Use, Freshwater Eutrophication, Acidification. |
Phase 2: Life Cycle Inventory (LCI) Analysis
The data collection and calculation phase to quantify relevant inputs and outputs.
- Experimental Protocol for Primary Data Collection in Biopolymer Production:
- System Description & Process Flow Diagram (PFD): Create a detailed PFD for the bioproduction facility, identifying all unit processes, material/energy flows, and emission points.
- Data Collection Plan: Design a plan targeting each unit process in the PFD. For a fermentation-based process (e.g., PHA production), key measurement points include:
- Feedstock Preparation: Mass of carbon source (e.g., glucose, glycerol), nutrients, process water; electricity for agitation.
- Fermentation/Bioprocessing: Direct measurement of electricity (kWh) for bioreactor operation (agitators, pumps, compressors for sterile air). Monitor and log cooling/heating energy.
- Downstream Processing: Solvent (e.g., chloroform, acetone) and antisolvent (e.g., methanol, ethanol) mass for polymer extraction. Energy for centrifugation, filtration, and drying (lyophilization or oven).
- Emissions & Wastes: Collect samples of off-gas for CO₂ analysis via GC-TCD. Characterize biomass residue composition for disposal or co-product credit.
- Data Validation: Perform mass and energy balance for each unit process and the entire system. Discrepancies >5% require investigation and recalibration.
- Data Aggregation: Aggregate all measured inputs/outputs relative to the defined Functional Unit (e.g., per kg of biopolymer).
Table 2: Simplified LCI Data Table for Hypothetical PHA from Glucose
| Inputs from Technosphere | Amount per kg PHA | Unit | Source |
|---|---|---|---|
| Glucose (from corn) | 3.2 | kg | Primary data |
| Potassium phosphate | 0.15 | kg | Primary data |
| Ammonium sulfate | 0.08 | kg | Primary data |
| Chloroform (for extraction) | 1.5 | kg | Primary data |
| Process Water | 120 | L | Primary data |
| Electricity (Mixing, Aeration) | 45 | kWh | Primary data |
| Natural Gas (Sterilization) | 8.5 | MJ | Primary data |
| Outputs to Environment | Amount per kg PHA | Unit | Method |
| Carbon Dioxide (Biogenic) | 2.8 | kg | Calculated stoichiometry |
| Biomass Residue (wet) | 5.0 | kg | Primary data |
| Wastewater (COD load) | 90 | g | Primary data |
Title: LCI Data Collection and Validation Workflow
Phase 3: Life Cycle Impact Assessment (LCIA)
The phase where inventory data is translated into potential environmental impacts.
Mandatory Elements:
- Selection of Impact Categories (e.g., Climate Change, Acidification).
- Classification: Assigning LCI flows to the chosen impact categories (e.g., CO₂, CH₄ to Climate Change; SO₂ to Acidification).
- Characterization: Calculating impact category results using characterization factors (CFs). Result = Σ (LCI flow * CF). E.g., GWP(CO₂)=1, GWP(CH₄)=28 CO₂-eq.
Optional Elements: Normalization, grouping, weighting, which are not permitted for comparative assertions.
Table 3: LCIA Characterization Table for 1 kg of Polymer (Illustrative)
| Impact Category | Indicator | Biopolymer A (PHA) | Polymer B (PP) | Unit | Basis |
|---|---|---|---|---|---|
| Global Warming | GWP100 | 2.1 | 3.8 | kg CO₂-eq | IPCC AR6 |
| Fossil Resource Scarcity | FRS | 15 | 85 | MJ | ReCiPe 2016 |
| Freshwater Eutrophication | FEP | 0.012 | 0.005 | kg P-eq | ReCiPe 2016 |
| Land Use | LU | 2.5 | 0.3 | m²a crop eq | ReCiPe 2016 |
Title: LCIA Mandary Elements Flow
Phase 4: Interpretation
The phase where findings from Phases 1-3 are analyzed to reach conclusions and recommendations.
- Key Steps:
- Identification of Significant Issues: Based on contribution, sensitivity, and uncertainty analysis, determine which inventory flows, impact categories, or lifecycle stages dominate the results (e.g., fermentation energy, solvent use in extraction).
- Evaluation: Assess completeness, sensitivity, and consistency of the study.
- Conclusions, Limitations, and Recommendations: Formulate robust conclusions aligned with the goal and scope, explicitly state limitations (e.g., data gaps for novel enzymes), and provide recommendations for both decision-makers and future research.
Title: Interpretation Phase Inputs and Outputs
The Scientist's Toolkit: Research Reagent & Material Solutions for Biopolymer LCA
Table 4: Essential Materials for Primary Data Generation in Biopolymer LCA
| Item / Reagent | Function in LCA Context | Technical Note |
|---|---|---|
| Gas Chromatograph (GC) with TCD/FID | Quantification of greenhouse gas emissions (CO₂, CH₄) from fermentation off-gas and combustion processes. | Enables precise measurement of biogenic vs. fossil carbon emissions. |
| COD (Chemical Oxygen Demand) Test Kits | Determination of organic load in wastewater streams from fermentation broth and downstream washing. | Critical for assessing eutrophication potential and wastewater treatment burdens. |
| Solvent Recovery System | For distillation and recycling of extraction solvents (e.g., chloroform, acetone). | Key technology to reduce inventory burdens in downstream processing. Model recovery efficiency (~85-95%). |
| Elemental Analyzer (CHNS/O) | Characterizes carbon, nitrogen, sulfur content in feedstocks, biopolymer, and residues. | Enables precise mass balances and calculation of emission factors. |
| Process Mass Spectrometer (PTR-MS) | Real-time monitoring of volatile organic compounds (VOCs) from bioreactors. | Captieves fugitive emissions often missed in standard LCI. |
| Life Cycle Inventory (LCI) Database Access | Provides background data for electricity, chemicals, transport, and waste treatment. | Essential for system completeness. Examples: Ecoinvent, GaBi, USLCI. |
| LCA Software (e.g., openLCA, SimaPro, GaBi) | Platform for modeling the product system, performing calculations, and managing LCI/LCIA data. | Ensures application of ISO-compliant methods and allocation procedures. |
Within the critical research on the life cycle assessment (LCA) of biopolymer production, sourcing robust and accurate Life Cycle Inventory (LCI) data is a foundational step. This guide provides an in-depth technical comparison between collecting primary data and utilizing three major secondary databases: ecoinvent, GREET, and USLCI. The selection directly influences the reliability, specificity, and applicability of the LCA results for researchers and development professionals.
Primary vs. Secondary LCI Data: Core Concepts
Primary Data is measured or collected directly from a specific process, system, or facility. In biopolymer research, this may involve primary data from pilot-scale reactors, purification units, or fermentation processes. Secondary (Background) Data is derived from literature, industry averages, or commercial databases and is used for generic processes (e.g., electricity grid mix, chemical production, transport).
| Database Name | Maintainer / Origin | Primary Geographic Scope | Key Features & Strengths | Common Use in Biopolymer LCA |
|---|---|---|---|---|
| ecoinvent | ecoinvent Centre, Switzerland | Global, with Swiss/European focus | Comprehensive, high-quality, multi-output processes, system models (Allocation, Cut-off). | Background data for energy, chemicals, materials, and waste management. |
| GREET | Argonne National Laboratory, USA | United States | Transportation fuel & vehicle cycle focus. Detailed biochemical & thermochemical pathways. | Assessing biofeedstock production, conversion processes, and fuel/energy co-products. |
| USLCI | National Renewable Energy Laboratory (NREL), USA | United States | Publicly available, unit process data, U.S. life cycle thinking foundation. | U.S.-specific background processes, especially energy and industrial materials. |
Quantitative Comparison of Key Database Parameters
Table 1: Core Database Characteristics & Accessibility (Data as of 2024)
| Parameter | ecoinvent (v3.9+) | GREET (2023/2024) | USLCI (2023) | Primary Data |
|---|---|---|---|---|
| License Cost | Commercial (Fee-based) | Free | Free | N/A (Cost of collection) |
| Data Format | EcoSpold, ILCD, LCI | Excel, openLCA | ILCD, JSON-LD | Spreadsheets, Proprietary |
| System Model | Allocation, Cut-off, Consequential | Displacement (for co-products) | Mostly Attributional | Defined by researcher |
| Update Frequency | ~Bi-annual | Annual | Periodic | Continuous |
| Transparency | High (detailed reports) | High (public docs) | High (open data) | Variable (internal) |
| Temporal Represent. | ~3-5 year lag | ~1-2 year lag | ~3-5 year lag | Current |
Table 2: Example Data Points Relevant to Biopolymer Production (Illustrative Values)
| Process / Flow | ecoinvent 3.9 | GREET 2023 | USLCI | Primary Data Example |
|---|---|---|---|---|
| U.S. Grid Electricity (kg CO2-eq/kWh) | 0.48 (US market) | 0.46 (National avg) | 0.47 | Specific facility: 0.52 |
| Corn (grain) prod., at farm (per kg) | 0.27 (CH) | Included in feedstock models | 0.31 (US avg) | Regional farm: 0.29 |
| Natural Gas, combusted (kg CO2/MJ) | 0.064 | 0.063 | 0.064 | Pilot plant meter: 0.064 |
| Polyethylene (HDPE) granulate (kg CO2-eq/kg) | 1.93 (GLO) | N/A (focus on resins) | 1.89 | Fossil comparator baseline |
Experimental Protocols for Primary Data Collection in Biopolymer Production
Protocol 1: Direct Measurement of Fermentation Process Inputs/Outputs
- Objective: To collect primary LCI data for the fermentation stage of a polyhydroxyalkanoate (PHA) production process.
- Methodology:
- System Boundary: Define unit process as "fermentation vessel from inoculation to broth harvest."
- Material Inputs: Precisely weigh all inputs: sterilized glucose feedstock, nutrient salts (N, P, K), inoculum volume, process water, antifoam agent.
- Energy Inputs: Install power meters on agitator motor, heating/cooling circulation system, and sterile air compressor. Record cumulative kWh over batch time.
- Outputs: Measure final broth volume and mass. Sample for dry cell weight and PHA content via Gas Chromatography (GC). Quantify off-gas composition (O2, CO2) using a real-time gas analyzer. Collect samples for wastewater characterization (BOD, COD).
- Data Recording: Record all measurements per batch, normalizing to a functional unit (e.g., per kg of biopolymer in broth).
Protocol 2: Utility Metering and Allocation for a Pilot Plant
- Objective: To allocate total plant energy and water use to a specific biopolymer production campaign.
- Methodology:
- Installation: Sub-meter electricity, steam, chilled water, and process water for the dedicated production line.
- Concurrent Monitoring: Run the biopolymer process and monitor all sub-meters continuously. Simultaneously, record total plant utility meters.
- Allocation: Use physical causality (e.g., energy meter readings) to allocate the majority of flows. For shared services (e.g., lab ventilation), use an appropriate allocator (e.g., floor area, operating hours).
- Calculation: Sum allocated and direct metered values to obtain total cradle-to-gate primary energy and water inventory for the campaign.
Data Sourcing Decision Pathway
Diagram Title: LCI Data Sourcing Decision Workflow
The Scientist's Toolkit: Essential Research Reagent Solutions for Primary LCI Data Collection
Table 3: Key Materials & Tools for Primary Data Acquisition
| Item / Reagent Solution | Function in Primary LCI Data Collection |
|---|---|
| Inline Process Analyzers (e.g., Mass Spectrometer, GC) | Real-time quantification of gas emissions (CO2, CH4) or product concentration in bioreactor off-gas/liquid streams. |
| Calibrated Load Cells & Flow Meters | Precise measurement of mass inputs (feedstock, chemicals) and liquid/gas flows (water, steam, air) into unit processes. |
| Data Logging Systems (SCADA/PLC) | Continuous electronic recording of sensor data (temperature, pressure, power) for temporal integration and analysis. |
| Laboratory Information Management System (LIMS) | Tracks sample provenance, analytical results (e.g., HPLC for sugar, GC for polymer content), and ensures data integrity. |
| Standard Reference Materials | Certified materials for calibrating analytical equipment, ensuring accuracy of compositional data used in mass balances. |
| Energy Meters (kWh, MJ) | Sub-metering of electricity, natural gas, or steam consumption for specific equipment or process lines. |
Within the broader thesis on the Life Cycle Assessment (LCA) of Biopolymer Production Research, this guide focuses on the four critical environmental impact categories most pertinent to biomedical-grade biopolymers (e.g., polylactic acid (PLA), polyhydroxyalkanoates (PHA), chitosan, hyaluronic acid). For researchers and drug development professionals, understanding the quantification and trade-offs of Global Warming Potential (GWP), Eutrophication, Land Use, and Water Consumption is essential for developing truly sustainable biomedical materials. These categories are central to the "cradle-to-gate" or "cradle-to-grave" analyses that form the core of LCA research.
Impact Categories: Definition and Relevance
Global Warming Potential (GWP)
Definition: GWP measures the radiative forcing of greenhouse gas (GHG) emissions over a specified time horizon (typically 100 years), expressed in kg CO₂-equivalents (kg CO₂-eq). It is the most reported LCA midpoint indicator. Relevance for Biomedical Biopolymers: While biopolymers are often derived from renewable biomass, their production is energy-intensive. Fossil-based electricity for fermentation, purification, and polymerization can lead to significant GHG emissions. Land-use changes for feedstock cultivation also release stored carbon.
Eutrophication
Definition: Eutrophication quantifies the excessive nutrient enrichment (particularly nitrogen (N) and phosphorus (P)) in aquatic and terrestrial ecosystems, leading to algal blooms and biodiversity loss. It is expressed in kg PO₄-equivalents or kg N-equivalents. Relevance for Biomedical Biopolymers: Agricultural runoff from fertilized crops grown for biopolymer feedstocks (e.g., corn for PLA, sugarcane for PHA) is a major contributor. Effluents from fermentation and downstream processing also contain nutrients that can cause eutrophication if not treated.
Land Use
Definition: Land Use assesses the occupation and transformation of land area over time, considering impacts on soil quality, biodiversity, and carbon sequestration. It is measured in square meter-years (m²a) or via more complex indicators like soil organic carbon loss. Relevance for Biomedical Biopolymers: Large-scale cultivation of dedicated energy crops for biopolymer feedstocks competes with food production and natural ecosystems, potentially leading to deforestation, soil degradation, and loss of habitat.
Water Consumption
Definition: Water Consumption evaluates the net removal of freshwater from its source, making it unavailable for other uses. It is measured in cubic meters (m³) and can be further characterized for regional scarcity. Relevance for Biomedical Biopolymers: Biopolymer fermentation and purification processes are water-intensive. Irrigation for feedstock agriculture often constitutes the most substantial portion of the total water footprint.
Table 1: Comparative LCA Impact Data for Selected Biomedical Biopolymers (Cradle-to-Gate) Note: Data are indicative ranges synthesized from recent literature (2020-2024) and vary based on geographic location, production efficiency, and allocation methods.
| Biopolymer (per 1 kg) | GWP (kg CO₂-eq) | Eutrophication (kg PO₄-eq) | Land Use (m²a) | Water Consumption (m³) |
|---|---|---|---|---|
| Polylactic Acid (PLA) | 1.2 - 3.4 | 0.005 - 0.018 | 1.5 - 3.8 | 0.20 - 0.60 |
| Polyhydroxyalkanoate (PHA) | 2.5 - 5.0 | 0.010 - 0.030 | 2.0 - 5.0 | 0.30 - 1.20 |
| Chitosan (from crustacean waste) | 0.8 - 2.5 | 0.015 - 0.040 | 0.1 - 0.5* | 0.10 - 0.40 |
| Fossil-based PET (Reference) | 2.5 - 3.5 | 0.002 - 0.008 | 0.2 - 0.5 | 0.05 - 0.15 |
*Land use for chitosan is typically low as it utilizes waste streams, but it includes the footprint of the original seafood production if allocated.
Table 2: Contribution Analysis for PLA Production (Approximate % of Total Impact)
| Life Cycle Stage | GWP | Eutrophication | Land Use | Water Consumption |
|---|---|---|---|---|
| Corn Cultivation | 25-35% | 70-85% | ~100% | 60-80% |
| Lactic Acid Fermentation | 30-45% | 10-20% | 0% | 15-30% |
| Polymerization & Processing | 25-40% | 5-15% | 0% | 5-15% |
Key Experimental Protocols for LCA in Biopolymer Research
Protocol for Life Cycle Inventory (LCI) Data Collection for Fermentation-Based Biopolymers (e.g., PHA)
Objective: To compile a comprehensive and accurate inventory of all inputs (energy, water, nutrients, feedstock) and outputs (product, emissions, waste) for a laboratory/pilot-scale PHA fermentation process.
- System Boundary Definition: Define a cradle-to-gate boundary: glucose production → fermentation → downstream recovery.
- Fermentation Process Monitoring:
- Feedstock Preparation: Accurately weigh all media components (e.g., glucose, salts, nitrogen source).
- Bioreactor Operation: Continuously log electricity consumption of the bioreactor (agitator, pumps, controls). Monitor and record compressed air (sterile air) consumption via a flow meter.
- Sampling & Analysis: Take periodic samples to measure PHA yield via Gas Chromatography (GC) after methanolysis. Measure residual substrate (e.g., glucose) via HPLC.
- Waste Stream Characterization: Collect all output streams (broth after extraction, spent media). Analyze for Chemical Oxygen Demand (COD), Total Nitrogen (TN), and Total Phosphorus (TP) using standard spectrophotometric kits (e.g., Hach methods).
- Upstream Data: Use commercial LCA databases (e.g., Ecoinvent, GaBi) for background processes like glucose production, electricity grid mix, and chemical manufacturing, scaled to your inventory masses.
- Data Normalization: Normalize all inputs and outputs per 1 kg of purified, dry PHA.
Protocol for Terrestrial Eutrophication Potential Assessment from Agricultural Feedstock
Objective: To quantify nitrogen and phosphorus leaching/runoff from corn cultivation for PLA feedstock.
- Field Study Design: Establish or utilize data from agricultural plots representative of the region supplying corn.
- Soil & Fertilizer Analysis: Pre-application, analyze soil for baseline N and P. Precisely record the type, quantity, and application method of all fertilizers.
- Leachate/Runoff Collection: Install lysimeters at the root zone to collect leachate and runoff collection systems at field edges.
- Sample Analysis: Collect water samples weekly and after major precipitation events. Analyze for nitrate (NO₃⁻) using ion chromatography or cadmium reduction methods, and for phosphate (PO₄³⁻) using the ascorbic acid method.
- Fate Factor Calculation: Calculate the fraction of applied N and P that is lost to freshwater systems. This site-specific emission factor (kg nutrient lost/kg applied) is then used in the LCA model, multiplied by the amount of fertilizer needed to grow the corn for 1 kg of PLA.
Visualizations
Title: Carbon Balance in Biopolymer Life Cycle
Title: Eutrophication Pathway from Biopolymer Production
The Scientist's Toolkit: Research Reagent & Material Solutions
Table 3: Essential Research Reagents and Materials for LCA-Informed Biopolymer Synthesis
| Item | Function/Application in Research | Relevance to Impact Categories |
|---|---|---|
| Defined Mineral Salts Media | Provides essential nutrients (N, P, K, Mg, trace metals) for controlled microbial fermentation (e.g., for PHA). | Enables precise quantification of nutrient inputs for eutrophication potential calculation. Reduces undefined waste. |
| Analytical Grade Solvents (e.g., Chloroform, Methanol) | Used in the extraction and purification of biopolymers (e.g., PHA) from cellular biomass. | A major contributor to process energy and toxicity impacts. Research focuses on replacing with greener solvents (e.g., ethyl acetate, methyl tert-butyl ether) to lower GWP and toxicity. |
| Immobilized Enzymes (e.g., Lipase, Protease) | Catalyze polymerization (e.g., ring-opening polymerization of PLA) or modification (e.g., chitosan hydrolysis) under mild conditions. | Reduces energy demand compared to traditional metal-catalyst or high-temperature processes, directly lowering GWP. |
| LCA Software & Database License (e.g., SimaPro, openLCA, Ecoinvent) | Essential for modeling the life cycle, calculating impact category results, and performing sensitivity analyses. | The core tool for quantifying all four impact categories based on experimental inventory data. |
| Standard Reference Materials for Analytics (e.g., PHA homopolymers, Chitosan standards) | Used to calibrate equipment (GC, HPLC, GPC) for accurate yield and molecular weight determination. | Critical for generating precise functional unit data (e.g., impact per kg of polymer with specific properties), which is foundational for a valid LCA. |
| Microfiltration/Ultrafiltration Membranes | Used for downstream processing to concentrate and purify biopolymers from fermentation broth. | Key to evaluating water consumption and recycling potential. Research focuses on fouling-resistant membranes to reduce energy (GWP) and water use. |
Allocation Methods for Multi-Product Systems (e.g., Corn for PLA vs. Food)
Life Cycle Assessment (LCA) is a cornerstone methodology for evaluating the environmental impacts of biopolymers like Polylactic Acid (PLA). A critical and often contentious element in conducting an LCA for such systems is the choice of allocation method. Multi-product systems, where a single feedstock (e.g., corn) is used for both material (PLA) and traditional (food, feed) markets, present a significant challenge. The method chosen to partition environmental burdens (e.g., GHG emissions, land use, water consumption) between co-products can dramatically alter the results and conclusions of the LCA, directly impacting the perceived sustainability of biopolymers. This guide provides a technical examination of prevalent allocation methods, their application, and experimental protocols for generating allocation data.
Core Allocation Methods: Principles and Applications
Allocation is required when a single process yields multiple valuable outputs (system expansion avoids allocation by broadening system boundaries). The following methods are most relevant to corn-PLA-food systems.
2.1 Physical Allocation This method partitions burdens based on a physical property common to all co-products.
- Basis: Mass, energy content (lower heating value), or carbon content.
- Application to Corn Refinery: Burdens of corn farming and primary processing are allocated to kernels based on mass. Subsequent processing burdens (wet milling) are allocated to products (starch, gluten feed, germ oil) based on mass or energy content.
- LCA Standards: Often preferred by ISO 14044 when a clear physical relationship exists.
2.2 Economic (Market Value) Allocation This method allocates burdens in proportion to the economic revenue generated by each co-product.
- Basis: Market price ($/kg) at the point of divergence (the "split-off" point).
- Application: If wet-milled starch for PLA commands a higher price per kg than gluten feed for cattle, it will be assigned a larger share of the upstream burdens. This method is sensitive to volatile market prices.
- LCA Standards: Recommended by ISO 14044 when physical relationships are not satisfactory, as it reflects the economic driver for the process.
2.3 System Expansion (Substitution) This is an avoidance method, not a partitioning method. The system boundary is expanded to include the avoided production of a functionally equivalent product.
- Basis: The co-product (e.g., corn gluten feed) is considered to displace a conventional product (e.g., soybean meal). The environmental burden of producing the displaced product is credited to the primary system.
- Application: In a PLA-from-corn system, the credits for displacing conventional animal feed can significantly reduce the net environmental impact allocated to the PLA.
- LCA Standards: Considered the most conceptually robust method but requires detailed data on the displaced product system.
Table 1: Comparison of Core Allocation Methods
| Method | Basis | Advantages | Disadvantages | Typical Impact on PLA LCA Result |
|---|---|---|---|---|
| Physical (Mass) | Mass of outputs | Simple, reproducible, price-independent. | Ignores product functionality and economic value. Can unfairly burden low-value, high-mass co-products. | Moderate burden for PLA. |
| Economic | Market value of outputs | Reflects economic reality, driver for production. | Prices are volatile and region-specific. Can make LCA results unstable over time. | High burden if PLA price is high; lower if feed prices are high. |
| System Expansion | Avoided burden of displaced product | Models market consequences, avoids partitioning. | Complex, requires additional data and assumptions about marginal displaced technology. | Often lowest net burden for PLA, due to feed displacement credits. |
Experimental Protocols for Generating Allocation Data
3.1 Protocol: Determining Co-Product Mass and Energy Flows
- Objective: To establish the mass and energy balance at the process split-off point for physical allocation.
- Materials: Industrial process data from wet milling facility, laboratory scale mass balance simulation.
- Methodology:
- Data Collection: Obtain precise mass flow data (kg/hr) for all input and output streams at the corn wet milling stage where starch, germ, fiber, and gluten separate.
- Sample Analysis: For each output stream, perform proximate analysis (AOAC International methods) to determine dry matter, crude protein, fat, and ash content.
- Calorimetry: Use a bomb calorimeter (e.g., IKA C2000) to determine the higher heating value (HHV) of each dried co-product stream.
- Balance Calculation: Construct a validated mass and energy balance model using software (e.g., Aspen Plus) to ensure data consistency. The ratios from this balance form the basis for physical allocation.
3.2 Protocol: Assessing Marginal Displacement for System Expansion
- Objective: To identify and quantify the product system displaced by a co-product (e.g., corn gluten feed, CGF).
- Materials: Agricultural market data, feed composition databases, LCA database software (e.g., Ecoinvent, AGRIBALYSE).
- Methodology:
- Market Analysis: Conduct a literature and market review to identify the most likely marginal feed ingredient displaced by CGF in the relevant geographic region (e.g., soybean meal, distillers grains).
- Nutritional Equivalence: Calculate the nutritional substitution ratio based on metabolizable energy and digestible protein content using feed formulation software (e.g., Brill Formulation).
- LCA Modeling: Model the complete life cycle of the displaced product (e.g., soybean meal: soybean cultivation, processing, transport).
- Credit Calculation: The environmental impact of producing 1 kg of the displaced product, multiplied by the substitution ratio, is the credit applied to the corn-PLA system.
Visualization of Methodological Decision Pathways
Diagram 1: Decision tree for selecting an LCA allocation method.
Diagram 2: System expansion concept for corn wet milling.
The Scientist's Toolkit: Research Reagent Solutions
Table 2: Essential Materials for Allocation Data Generation
| Item / Reagent | Function / Application | Example Product / Specification |
|---|---|---|
| Bomb Calorimeter | Determines the higher heating value (HHV) of co-products for energy-based allocation. | IKA C2000 Basic Calorimeter, oxygen filling device. |
| Proximate Analyzer | Measures moisture, ash, volatile matter, and fixed carbon content in biomass/co-product samples. | LECO TGA801 Thermogravimetric Analyzer. |
| Feed Formulation Software | Calculates nutritional equivalence ratios for system expansion in animal feed displacement. | Brill Formulation, Format International. |
| LCA Database Software | Provides life cycle inventory data for background processes (e.g., farming, displaced products). | Ecoinvent database v3.9, AGRIBALYSE (for French context). |
| Process Simulation Software | Models mass and energy balances of complex biorefinery processes for precise flow data. | Aspen Plus v12, SuperPro Designer. |
| Agricultural Market Databases | Source for historical and current market prices of co-products for economic allocation. | USDA PS&D Database, FAOStat. |
This technical guide provides an in-depth analysis of three leading Life Cycle Assessment (LCA) modeling software platforms—SimaPro, GaBi, and OpenLCA—within the specific research context of a thesis on the life cycle assessment of biopolymer production. For researchers, scientists, and professionals in drug development and related fields, the selection of an appropriate LCA tool is critical for conducting robust, transparent, and scientifically valid environmental impact assessments of novel biomaterials. These tools facilitate the modeling of complex supply chains, from agricultural feedstock cultivation to polymerization and end-of-life, which are central to evaluating the sustainability claims of biopolymers intended for medical and pharmaceutical applications.
Software Core Architectures & Databases
Fundamental Architecture
Each software employs a distinct core architecture that influences modeling flexibility, computational efficiency, and integration capabilities.
- SimaPro: Utilizes a process-based, matrix-calculation engine. It structures an LCA model as a system of linear equations, where the technology matrix (A) describes process flows, the intervention matrix (B) links processes to elementary flows, and a final demand vector (f) defines the functional unit. The solution vector (s) is calculated as s = A⁻¹ f, with total emissions/consumption given by B s. This approach is rigorous for managing large, interconnected systems.
- GaBi: Employs a foreground/background hybrid model with a plan-oriented structure. The user builds a model by connecting plan elements (processes) in a flowchart. It combines specific foreground data with comprehensive, integrated background databases. GaBi's calculation kernel is optimized for iterative scenarios and parameterized modeling, allowing for dynamic sensitivity analysis.
- OpenLCA: Features an open, modular architecture built on an entity-relationship model. Its core is a process graph calculation engine that traverses a network of connected processes. Unlike the matrix solution, it can employ various algorithms (e.g., graph traversal, contribution tree) to compute results, offering flexibility. Its open Application Programming Interface (API) allows for deep integration and custom development.
Critical Database Content
The availability of relevant lifecycle inventory (LCI) data is paramount for biopolymer LCA. Key databases and their relevance to biopolymer production are summarized below.
Table 1: Core LCI Databases and Relevance to Biopolymer Research
| Software | Primary Databases | Key Content for Biopolymer Production | Update Frequency |
|---|---|---|---|
| SimaPro | Ecoinvent, USLCI, Agri-footprint, ETH-ESU 96 | Extensive data on agricultural inputs (fertilizers, pesticides), energy mixes, chemical intermediates (e.g., succinic acid, lactic acid), and conventional plastics. Agri-footprint is critical for crop-based feedstocks. | Major databases updated annually or bi-annually. |
| GaBi | GaBi Professional Database, GaBi Extension Database X: Chemicals | Highly detailed, industry-focused data on petrochemical and emerging biochemical processes. Includes specific datasets for polymers (PLA, PHA, bio-PET) and pharmaceutical-grade precursors. | Continuous updates via service package; major annual releases. |
| OpenLCA | openLCA Nexus (hosting Agribalyse, ELCD, ecoinvent*, NEED), proprietary db imports | Access to free databases like Agribalyse (agricultural data) and flexibility to import customized or commercial databases (e.g., ecoinvent). Enables creation of specialized, open-access biopolymer databases. | Depends on source database; Nexus platform allows community-driven updates. |
Note: ecoinvent requires a separate license for use in any software.
Methodological Implementation & Experimental Protocols
Conducting an LCA for biopolymer production follows the ISO 14040/44 stages. Below is a detailed protocol applicable across tools, with software-specific notations.
Protocol: Goal and Scope Definition for a Biopolymer
- Define Functional Unit (FU): Precisely quantify the function of the system (e.g., "1 kilogram of sterile, injection-molded polylactic acid (PLA) granulate suitable for pharmaceutical device fabrication").
- Define System Boundaries: Employ a cradle-to-gate approach for material comparison, or cradle-to-grave for final product assessment. Key processes include:
- Foreground System: Cultivation of biomass (e.g., corn, sugarcane), pretreatment, fermentation, monomer separation, polymerization, and pelletization.
- Background System: Production of ancillary chemicals, enzymes, utilities (steam, electricity), and infrastructure.
- Allocation Procedures: For multi-output processes (e.g., a biorefinery producing dextrose and lignin), define allocation rules—mass, economic, or energy content—as per ISO guidelines. Advanced modeling using system expansion is preferred when possible.
- Impact Assessment Selection: Choose LCIA methods relevant to biogenic carbon and resource use (e.g., EF 3.0, ReCiPe 2016, IPCC 2021 GWP). Consider specific categories like land use change, water consumption, and eutrophication.
Protocol: Inventory Modeling (Foreground Data Integration)
This phase involves building the computational model within the chosen software.
Workflow for Inventory Modeling in LCA Software
Table 2: Key Research Reagent & Material Solutions for Biopolymer LCA
| Item/Reagent | Function in Biopolymer Production | Relevance in LCA Modeling |
|---|---|---|
| Enzyme Cocktails (e.g., Cellulase, Amylase) | Hydrolyzes lignocellulosic or starch-based biomass into fermentable sugars (glucose, xylose). | Key upstream energy/material input; impacts yield and environmental burden of sugar platform. |
| Genetically Modified Microorganism (e.g., E. coli, S. cerevisiae) | Ferments sugars to target monomers (lactic acid, succinic acid) with high yield and titer. | Defines core conversion efficiency, nutrient/energy requirements, and potential downstream separation complexity. |
| Organic Solvents (e.g., Ethyl Acetate, Dichloromethane) | Used in purification and separation of monomers from fermentation broth. | Significant contributor to process emissions, energy for recovery, and toxicity impacts. |
| Catalyst Systems (e.g., Sn(Oct)₂, Enzymatic Catalysts) | Facilitates ring-opening polymerization (ROP) or polycondensation of monomers. | Contributes to material inventory; metal catalysts can influence toxicity impact categories. |
| High-Purity Inert Gas (N₂, Ar) | Used to create anaerobic fermentation conditions and in polymerization reactors. | Embodied energy of gas production and compression is modeled as an energy flow. |
Comparative Analysis of Outputs & Advanced Features
Data Presentation & Visualization
Each tool offers distinct ways to analyze and present results.
Table 3: Comparative Analysis of Software Outputs & Advanced Features
| Feature | SimaPro | GaBi | OpenLCA |
|---|---|---|---|
| Primary Result Formats | Contribution analysis tree, detailed tables, bar/pie charts. | Process & flow contributions, portfolio results, spider diagrams. | Contribution analysis network graph, Sankey diagrams, tables. |
| Monte Carlo Analysis | Highly integrated, detailed statistical output (histograms, statistical plots). | Integrated, with clear parameter distribution definition and result aggregation. | Available via native feature and enhanced through plugins (e.g., olca-ipc). |
| Parameterization & Scenario | Strong support for parameters and uncertainty. Scenario manager for comparative studies. | Core strength: Advanced parameterization, global variables, and scenario modeling. | Full parameterization support; scenario analysis via dedicated functions. |
| API/Scripting | Limited direct API; uses PHP for customization in certain exports. | Scripting interface (GaBi LP) for automation and custom models. | Core strength: Fully open Java API and scripting (olca-ipc) for automation, integration, and custom tools. |
| Interoperability | Supports LCI, LCIA, and ILCD formats. | Strong exchange via native formats and ILCD. | Excellent import/export (ILCD, JSON-LD, EcoSpold) facilitating open science. |
Advanced Modeling: Biogenic Carbon & Land Use
Modeling biogenic carbon cycles and land use impacts is critical for biopolymers.
- Biogenic Carbon Modeling: SimaPro and OpenLCA allow explicit modeling of CO₂ flows from atmosphere to biomass and back, using separate flow categories. GaBi handles this via specific "biogenic carbon" flows and attributes in its database. The correct temporal accounting (e.g., using the GWP-biogenic metric) is method-dependent.
- Land Use Change (LUC): Integrating LUC emissions (e.g., via IPCC factors) requires linking foreground land use data to specific emissions (e.g., 1 kg CO₂-eq per kg biomass from deforestation). This is typically done by creating a dedicated LUC emission process or using characterization factors from methods like EF 3.0.
The choice of software for an LCA thesis on biopolymer production depends on research priorities. SimaPro offers methodological rigor and academic pedigree, suitable for detailed, ISO-compliant studies. GaBi provides deep, industry-relevant databases and powerful scenario modeling for process optimization. OpenLCA is ideal for open-science, transparent, and customizable research, particularly when developing novel databases or integrating with other computational tools.
Researchers should select based on database needs (access to specific agricultural or chemical data), the requirement for advanced parameterization or open-source collaboration, and the computational complexity of the envisioned biopolymer system models.
Overcoming LCA Challenges: Data Gaps, Sensitivity, and Improving Environmental Performance
Addressing Data Uncertainty and Variability in Agricultural and Fermentation Processes
Within the framework of Life Cycle Assessment (LCA) for biopolymer production, addressing data uncertainty and variability is paramount for generating reliable, actionable sustainability metrics. Agricultural feedstock cultivation and microbial fermentation are the two foundational bioprocess stages characterized by significant inherent stochasticity. This guide provides a technical roadmap for researchers to quantify, manage, and mitigate these uncertainties to enhance the credibility of comparative LCA studies.
2.1 Agricultural Stage
- Temporal & Spatial Variability: Year-to-year climate fluctuations, soil heterogeneity, and regional agricultural practices.
- Input Data Uncertainty: Inconsistent reporting of fertilizer/pesticide application rates, irrigation volumes, and machinery use.
- Model Uncertainty: Emissions modeling for N₂O, soil carbon changes, and nutrient leaching.
2.2 Fermentation Stage
- Biological Variability: Strain instability, phenotypic noise, and batch-to-batch differences in microbial consortia.
- Process Parameter Uncertainty: Measurement errors in pH, temperature, dissolved oxygen, and substrate feed rates.
- Scale-up Uncertainty: Discrepancies in yield, titer, and rate between lab-scale bioreactors and industrial production.
Quantitative Data Synthesis
Table 1: Typical Uncertainty Ranges in Key LCA Inventory Parameters
| Process Stage | Parameter | Typical Range (Mean ± CV%) | Primary Source of Variability |
|---|---|---|---|
| Agriculture | Nitrogen Fertilizer Application | ± 15-25% | Farmer practice, soil testing |
| N₂O Field Emissions (IPCC Tier 1) | ± 50-100% | Climate, soil type, management | |
| Crop Yield (e.g., Corn) | ± 10-20% | Weather, pests, genetics | |
| Fermentation | Product Yield (g/g substrate) | ± 5-15% | Strain performance, process control |
| Energy for Sterilization (kWh/m³) | ± 10-20% | Equipment efficiency, batch size | |
| Downstream Recovery Yield | ± 2-10% | Separation technology, product loss |
Table 2: Common Statistical Distributions for Parameter Modeling
| Parameter Type | Recommended Distribution | Justification |
|---|---|---|
| Fertilizer Inputs | Lognormal | Cannot be negative, right-skewed data |
| Emission Factors | Beta or Uniform | Bounded, often lack distributional data |
| Technical Yields | Normal or Truncated Normal | Central limit theorem, symmetrical bounds |
| Cost Factors | Triangular | Minimum, most likely, maximum estimates |
Methodologies for Uncertainty Quantification
4.1 Protocol: Probabilistic Life Cycle Assessment (pLCA) using Monte Carlo Simulation
- Objective: Propagate input parameter uncertainties through the LCA model to quantify uncertainty in output impact categories (e.g., GWP).
- Procedure:
- Define Input Distributions: Assign probability distributions (Table 2) to each uncertain inventory parameter (Table 1) based on primary data or literature.
- Correlation Assignment: Identify and define correlations between parameters (e.g., higher yield may correlate with higher fertilizer use).
- Model Execution: Run the LCA calculation 10,000 times (iterations), each time sampling a random value from each input distribution.
- Output Analysis: Analyze the resulting distribution of impact scores to determine confidence intervals (e.g., 95% percentile range) and key contributors to overall uncertainty.
4.2 Protocol: Global Sensitivity Analysis (Sobol Method)
- Objective: Decompose the output variance to identify which input parameters contribute most to the final uncertainty.
- Procedure:
- Model Setup: Implement the pLCA model as above.
- Sampling: Generate a quasi-random (Sobol) sequence of input samples to ensure efficient space-filling.
- Variance Calculation: Compute first-order (main effect) and total-order (including interactions) Sobol indices for each input parameter.
- Interpretation: Parameters with high total-order indices (>0.1) are priority targets for better data collection to reduce overall output uncertainty.
Experimental Protocols for Reducing Data Gaps
5.1 Protocol: Tiered Agricultural Field Data Collection
- Purpose: Generate primary, site-specific inventory data with known variability.
- Design: Implement a stratified random sampling design across multiple fields and growing seasons.
- Measurements: Record all inputs (seeds, fertilizers, pesticides, water, diesel) with calibrated equipment. Measure yields via standardized harvest plots. Collect soil samples pre- and post-season for carbon/nitrogen analysis.
- Data Processing: Calculate mean values and coefficients of variation (CV) for each parameter. Perform ANOVA to separate spatial from temporal variability.
5.2 Protocol: High-Throughput Fermentation Screening with Design of Experiments (DoE)
- Purpose: Quantify the effect and interaction of critical process parameters (CPPs) on fermentation performance and its variability.
- Design: Use a Response Surface Methodology (RSM) design (e.g., Central Composite Design) with factors like pH, temperature, and C/N ratio.
- Execution: Perform parallel microbioreactor (e.g., 48-well plate or mini-bioreactor array) runs according to the DoE matrix.
- Responses: Measure key performance indicators (KPIs): titer, yield, productivity, and their standard deviations across technical replicates.
- Analysis: Fit a quadratic model to identify optimal setpoints that maximize yield while minimizing performance variance.
Visualization of Workflows and Relationships
Flowchart for Probabilistic LCA and Sensitivity Analysis
DoE Workflow for Robust Fermentation Process Development
The Scientist's Toolkit: Research Reagent Solutions
Table 3: Essential Materials for Uncertainty-Aware Bioprocess Research
| Item | Function in Uncertainty Mitigation | Example/Supplier |
|---|---|---|
| Mini/Micro-Bioreactor Systems (e.g., BioLector, ambr) | Enable high-throughput, parallel fermentation runs for robust DoE studies, quantifying biological and process variability. | m2p-labs, Sartorius |
| Environmental Sensors (IoT-enabled) | Provide continuous, high-frequency field data (soil moisture, N, temperature) to characterize spatial/temporal variability in agriculture. | METER Group, Campbell Scientific |
| Stable Isotope Tracers (¹³C, ¹⁵N) | Precisely track carbon/nitrogen flows in fermentation or soil, reducing model uncertainty in emission and metabolic pathway analyses. | Cambridge Isotopes, Sigma-Aldrich |
| Process Analytical Technology (PAT) | In-line sensors (for pH, DO, biomass, substrates) enable real-time monitoring and control, reducing measurement uncertainty in fermentation. | Hamilton, Sartorius (BioPAT) |
| Statistical Software Packages | Perform Monte Carlo simulation, sensitivity analysis, and experimental design. Critical for quantitative uncertainty management. | R (simpar), Python (SALib), JMP, SimaPro |
| Reference Life Cycle Inventory Databases | Provide pre-quantified uncertainty distributions (e.g., ecoinvent pedigree matrix) for background system data in pLCA. |
ecoinvent, AGRIBALYSE |
1. Introduction Within the comprehensive framework of a thesis on the Life Cycle Assessment (LCA) of biopolymer production, sensitivity analysis (SA) is a critical methodological step. It moves beyond deterministic results to identify which input parameters—such as energy source, feedstock yield, enzyme efficiency, or solvent recovery rate—most significantly influence the overall environmental impact. This guide provides researchers and development professionals with a technical protocol for conducting robust SA in biopolymer LCA studies.
2. Core Methodological Framework for Sensitivity Analysis A two-pronged approach is recommended: local (one-at-a-time) and global sensitivity analysis.
- Local Sensitivity Analysis (LSA): Assesses the effect of small perturbations of one parameter at a time around a baseline.
- Protocol: For a chosen impact category (e.g., Global Warming Potential, GWP), calculate the baseline result. Then, vary a single input parameter (e.g., grid electricity consumption) by a standardized percentage (±10% is common), holding all others constant. Recalculate the impact. The sensitivity coefficient (S) is: S = (ΔOutput / Outputbaseline) / (ΔInput / Inputbaseline).
- Global Sensitivity Analysis (GSA): Evaluates how the output uncertainty is apportioned to the uncertainty in all input parameters simultaneously, capturing interaction effects.
- Protocol (Monte Carlo-based):
- Define probability distributions for all key uncertain input parameters (e.g., normal distribution for yield, uniform for catalyst loading).
- Using software (e.g., openLCA, SimaPro, or R/Python scripts), perform Monte Carlo simulation (e.g., 10,000 iterations), randomly sampling from each parameter distribution.
- Analyze output distributions using statistical methods. Sobol’ indices are a common GSA metric, quantifying first-order (main effect) and total-order (including interactions) sensitivity indices.
- Protocol (Monte Carlo-based):
3. Key Driver Identification: Quantitative Data Synthesis The table below synthesizes findings from recent LCA studies on polylactic acid (PLA) and polyhydroxyalkanoates (PHA) production, highlighting sensitive parameters.
Table 1: Sensitivity of Biopolymer Production GWP to Key Parameters
| Biopolymer | Parameter (Baseline Value) | Variation | Resulting GWP Change | Sensitivity Coefficient (S) | Analysis Type |
|---|---|---|---|---|---|
| PLA (Corn feedstock) | Grid Electricity (0.5 kWh/kg PLA) | +20% | +12.5% | 0.63 | LSA |
| PLA (Corn feedstock) | Corn Grain Yield (9.8 Mg/ha) | -15% | +9.8% | 0.65 | LSA |
| PHA (Bacterial fermentation) | Sodium Hypochlorite (Solvent, 6 kg/kg PHA) | +25% | +18.2% | 0.73 | LSA |
| PHA (Bacterial fermentation) | Fermentation Yield (0.3 g PHA/g sugar) | +10% | -14.5% | -1.45 | LSA |
| PLA (Multiple feedstocks) | All Parameters (Monte Carlo) | - | Sobol' Total-Order Indices: Energy Source (0.71), Agricultural Yield (0.52), Process Efficiency (0.23) | - | GSA |
4. Experimental Protocols for Underlying Data Generation Protocol 4.1: Determining Fermentation Yield for PHA.
- Objective: Quantify PHA accumulation yield from a specific bacterial strain and carbon source.
- Materials: See Scientist's Toolkit.
- Method:
- Inoculate 50 mL of defined mineral medium with 1% (v/v) overnight pre-culture of the production strain (e.g., Cupriavidus necator).
- Incubate at 30°C, 200 rpm. Allow growth until late exponential phase.
- Induce PHA accumulation by adding a carbon source (e.g., 20 g/L fructose) under nitrogen limitation.
- Harvest cells at 48h post-induction by centrifugation (10,000 x g, 10 min).
- Lyophilize cell biomass and measure PHA content via gas chromatography (GC) after methanolysis.
- Calculation: PHA Yield (YP/S) = (PHA mass produced (g)) / (Sugar mass consumed (g)).
Protocol 4.2: Measuring Enzymatic Hydrolysis Efficiency for Lignocellulosic Feedstock.
- Objective: Determine glucose yield from pretreated biomass for subsequent fermentation.
- Method:
- Load 1% (w/v) dry mass of pretreated feedstock (e.g., wheat straw) into a bioreactor with citrate buffer (pH 4.8).
- Dose with a commercial cellulase cocktail (e.g., 15 FPU/g glucan).
- Hydrolyze at 50°C, 150 rpm for 72h.
- Sample periodically, centrifuge, and analyze supernatant for glucose concentration via HPLC.
- Calculation: Hydrolysis Efficiency (%) = (Glucose released (g) x 0.9) / (Potential glucan in feedstock (g)) x 100.
5. Visualizing Sensitivity Analysis Workflows
Diagram 1: Sensitivity Analysis Workflow for Biopolymer LCA
6. The Scientist's Toolkit: Research Reagent Solutions Table 2: Essential Materials for Key Experiments in Biopolymer LCA Data Generation
| Item | Function in Context | Example/Supplier |
|---|---|---|
| Defined Mineral Medium (e.g., M9) | Provides essential nutrients (N, P, trace metals) for controlled microbial PHA production, allowing accurate yield measurement. | Sigma-Aldrich, Custom formulation |
| Commercial Cellulase Cocktail | Standardized enzyme mixture for hydrolyzing pretreated biomass to sugars; a key parameter for feedstock conversion efficiency. | Cellic CTec3 (Novozymes) |
| Polylactic Acid (PLA) Standards | Certified reference materials for calibrating analytical equipment (e.g., GC, HPLC) to quantify monomers or polymer content. | Sigma-Aldrich, LGC Standards |
| Anhydrous Sodium Acetate (HPLC Grade) | Mobile phase component for accurate chromatographic separation and quantification of organic acids and sugars from fermentation broths. | Fisher Chemical, Honeywell |
| Lyophilizer (Freeze Dryer) | Preserves biomass for accurate dry weight measurement and subsequent polymer analysis without thermal degradation. | Labconco, Martin Christ |
| Microbial Strain (e.g., C. necator DSM 428) | Standardized production organism for generating reliable, reproducible PHA yield data under defined conditions. | DSMZ, ATCC |
1. Introduction: Integration within a Life Cycle Assessment Framework
This whitepaper details two primary technical strategies for reducing the environmental footprint of biopolymer production, a critical focus within Life Cycle Assessment (LCA) research. The "use phase" of energy in bioprocessing and the intensity of resource consumption in fermentation and downstream processing dominate the impact profile. Directly addressing these through Renewable Energy Integration (REI) and Process Intensification (PI) offers the most significant leverage points for impact reduction, moving the industry toward sustainable manufacturing paradigms.
2. Renewable Energy Integration in Biopolymer Fermentation
Integrating renewable energy sources directly into bioprocess facilities decouples production from fossil-based grids, drastically reducing greenhouse gas (GHG) emissions associated with the inventory phase.
2.1 Current Energy Mix & Impact Data A comparative LCA of polyhydroxyalkanoate (PHA) production reveals the decisive role of energy source.
Table 1: Cradle-to-Gate GHG Emissions for PHA Production (Functional Unit: 1 kg PHA)
| Energy Scenario | Total GHG Emissions (kg CO₂-eq/kg PHA) | Reduction vs. Grid Mix | Key Notes |
|---|---|---|---|
| Conventional Grid Mix | 3.8 - 5.2 | Baseline | Highly dependent on regional grid carbon intensity. |
| On-site Solar PV Integration | 1.9 - 2.5 | 40-55% | Requires battery storage or hybrid system for 24/7 operation. |
| Off-site Wind Power PPA | 1.5 - 2.1 | 50-60% | Power Purchase Agreement (PPA) ensures renewable attribution. |
| Biomass-Based Combined Heat & Power (CHP) | 1.2 - 1.8 | 60-70% | Utilizes waste lignocellulosic biomass; provides process heat. |
2.2 Experimental Protocol: Modeling Hybrid Renewable Systems for Bioreactors
Objective: To design and validate a control system for a solar PV-wind hybrid system powering a 10 L fermenter for continuous PHA production.
Protocol:
- System Sizing: Using historical insolation and wind data for the site, size PV arrays and wind turbines using the HOMER Pro software to meet a base load of 500W (agitator, pumps, controls) with a peak of 800W (chiller during exothermic phase).
- Energy Management System (EMS): Develop a rule-based EMS in a programmable logic controller (PLC). Priority is given to direct PV/wind power. Excess energy charges a battery bank (Li-ion). Grid power (or backup generator) is engaged only when state-of-charge (SOC) falls below 20%.
- Fermentation Integration: Instrument the bioreactor to transmit real-time power demand to the EMS. Correlate dissolved oxygen (DO) spikes (indicating high agitator demand) with renewable availability.
- LCA Validation: Meter all energy inputs (grid, renewable direct, from battery). Using real emission factors, calculate the real-time carbon intensity of the fermentation (g CO₂-eq/L broth) and compare to a grid-only control experiment.
Diagram Title: Hybrid Renewable Energy System for Biopolymer Fermentation
3. Process Intensification Strategies for Impact Reduction
PI aims to maximize production efficiency per unit volume, time, and energy, directly reducing material and energy inputs per kg of biopolymer.
3.1 Key PI Technologies & Performance Data
Table 2: Process Intensification Strategies and Documented Impact Reductions
| PI Strategy | Technical Approach | Documented Outcome (vs. Conventional) | Impact Reduction Mechanism |
|---|---|---|---|
| High-Cell Density Fermentation (HCD) | Advanced feeding strategies (e.g., DO-stat), in-situ product removal. | 3-5x increase in volumetric productivity. | Smaller reactor volume, lower sterilization energy. |
| Continuous Fermentation | Chemostat or perfusion systems with cell recycle. | 50% reduction in water use, 40% less energy. | Eliminates downtime (cleaning, filling), steady-state operation. |
| Membrane-Based Downstream Processing | Integrated microfiltration/ultrafiltration for cell separation and product concentration. | 70% reduction in chemical flocculants, 60% less thermal energy. | Replaces energy-intensive centrifugation and evaporation. |
| Reactive Extraction | In-line product separation using green solvents (e.g., ethyl lactate). | Reduces downstream steps from 5 to 2. | Combines reaction and separation, cutting processing time and energy. |
3.2 Experimental Protocol: Intensified PHA Production via Perfusion Fermentation
Objective: To establish a continuous perfusion process for PHA-producing Cupriavidus necator and compare its LCA impacts to batch culture.
Protocol:
- Bioreactor Setup: Configure a 5 L bioreactor with an external hollow-fiber membrane (0.2 µm pore) cell retention device. The medium feed rate (Fin) and permeate harvest rate (Fout) are controlled via peristaltic pumps.
- Inoculation & Transition: Start in batch mode. At late exponential phase (OD₆₀₀ ~40), initiate perfusion. Set Fin = Fout = 0.5 Vessel Working Volume per day (D = 0.5 day⁻¹).
- Process Control: Maintain DO at 30% via cascading agitation and aeration. pH is controlled at 6.8. Nitrogen source is limited in the feed medium to trigger PHA accumulation once high cell density (>100 g CDW/L) is achieved.
- Monitoring & LCA: Sample daily for cell dry weight (CDW), PHA content (GC-MS), and residual nutrients. Meter all utilities (electricity, steam, water). Operate for 10 residence times. Compare to a batch control producing the same total PHA mass.
- Downstream Integration: Harvested permeate (cell-free broth) is directed to a continuous tubular centrifuge for initial product separation, followed by a continuous supercritical CO₂ extraction unit for PHA purification.
Diagram Title: Intensified Perfusion Process for PHA Production
4. The Scientist's Toolkit: Research Reagent Solutions
Table 3: Essential Materials for Advanced Biopolymer LCA Research
| Item Name / Solution | Function / Rationale |
|---|---|
| C. necator H16 (PHA Producer) | Model organism for PHA synthesis from diverse carbon sources. Well-characterized genetics. |
| Synthetic & Defined Medium Kits | Enables precise carbon/nitrogen tracking for accurate material flow analysis in LCA. |
| In-situ Probe Kits (DO, pH, Biomass) | For real-time monitoring and control in intensified processes (perfusion, HCD). |
| Green Solvent Kits (e.g., Ethyl Lactate, Cyrene) | For sustainable downstream processing experiments, replacing halogenated solvents. |
| LCA Software Licenses (e.g., SimaPro, openLCA) | Essential for modeling and quantifying the impacts of REI and PI interventions. |
| Process Analytical Technology (PAT) Probes (FTIR, Raman) | For real-time monitoring of PHA content in broth, enabling feedback control. |
| Microfiltration/Ultrafiltration Test Modules | For lab-scale development of membrane-based cell retention and product concentration. |
The environmental claims of biopolymers (e.g., PLA, PHA, cellulose-based materials) are contingent not on production alone but on their managed end-of-life (EoL). Life Cycle Assessment (LCA) research must integrate rigorous EoL scenario modeling to compare the systemic impacts of disposal pathways. For biomedical applications—where materials may be drug-loaded or contaminated—modeling complexity increases. This guide details technical protocols and data for modeling four critical EoL scenarios: Industrial Composting, Anaerobic Digestion (AD), Mechanical Recycling, and Biomedical Waste Treatment, within an LCA framework.
Table 1: Characteristic Conversion Efficiencies and Outputs by EoL Pathway
| EoL Pathway | Key Process Parameters | Typical Conversion Efficiency (%) | Primary Outputs | GHG Impact (kg CO2-eq/kg waste)* | Data Source Key |
|---|---|---|---|---|---|
| Industrial Composting | Temperature: 55-60°C, Time: 180 days, Moisture: 50-60% | Biodegradation: 60-90 (for compliant biopolymers) | Compost, CO2, H2O, Heat | -0.1 to 0.3 (credit for compost use) | R&D, ECN, 2023 |
| Anaerobic Digestion (AD) | Retention: 20-40 days, Mesophilic: 35-37°C, Organic Loading Rate: 3-5 kg VS/m³/day | Biogas Yield: 400-800 m³/ton VS, Methane Content: 50-70% | Biogas (CH4, CO2), Digestate | -0.4 to 0.1 (credit for energy recovery) | IEA Bioenergy, 2024 |
| Mechanical Recycling | Sorting (NIR), Washing, Extrusion (190-220°C for PLA) | Mass Yield: 70-85%, Quality Loss per Cycle: 15-25% property reduction | Recycled Polymer Flakes/Pellets | -1.5 to -0.8 (credit for virgin material offset) | Waste Management, 2023 |
| Biomedical Waste Incineration | Temperature: 850-1100°C, Residence Time: >2 sec, APC systems | Mass Reduction: >90%, Energy Recovery: 0.5-1.0 MWh/ton waste | Heat, Electricity, Bottom Ash, Fly Ash | 0.5 to 1.2 (net, without energy credit) | WHO Guidelines, 2022 |
*Negative values indicate net savings/credits. VS = Volatile Solids. APC = Air Pollution Control. Values are scenario-dependent and for modeling inputs.
Table 2: Fate of Common Biopolymer Additives and Drug Residues in EoL Pathways
| Contaminant/Additive | Industrial Composting | Anaerobic Digestion | Mechanical Recycling | Biomedical Incineration |
|---|---|---|---|---|
| PLA Plasticizer (e.g., ATBC) | Partial biodegradation, remainder in compost | Potential inhibition >2% w/w, accumulates in digestate | Carries over to recycled polymer | Complete destruction |
| Antibiotic Drug Residue | Partial degradation, risk of soil uptake | Variable degradation, potential for methanogen inhibition | High risk of contaminating recycle stream | >99.99% destruction |
| Heavy Metal Catalyst (Sn, Zn) | Immobilized in compost matrix, soil accumulation | Immobilized in digestate | Concentrated in recycled polymer | Partitioned to fly ash/bottom ash |
| Lignin (in composites) | Recalcitrant, reduces overall degradation rate | Recalcitrant, lowers biogas yield | Acts as impurity, affects melt properties | Contributes to calorific value |
Experimental Protocols for EoL Parameter Determination
Protocol 3.1: Biodegradation under Industrial Composting Conditions
- Objective: Determine the ultimate biodegradability of a biopolymer film as per ISO 14855-1.
- Materials: Test material (≤2 mm particles), mature compost inoculum, positive control (microcrystalline cellulose), negative control (polyethylene), hermetic respirometric vessels.
- Method:
- Mix solid inoculum (200 g, dry weight) with test material (10 g, dry weight) to achieve a C:N ratio ~20:1.
- Place in vessel, adjust moisture to 50-60% water holding capacity. Flush with air, seal.
- Incubate at 58°C ± 2°C in a temperature-controlled chamber.
- Continuously measure CO2 evolution via automated titration or gas chromatography over 180 days.
- Calculate biodegradability percentage: (Cumulative CO2 from test material – Cumulative CO2 from blank) / (Theoretical CO2 of test material) x 100.
Protocol 3.2: Methane Potential in Anaerobic Digestion
- Objective: Assess biochemical methane potential (BMP) of a drug-loaded biopolymer nanofiber.
- Materials: Inoculum (anaerobic sludge from wastewater plant), substrate (test nanofiber, ~1 g VS), serum bottles (500 mL), ANKOM Gas Production System, gas chromatograph.
- Method:
- Degas inoculum under N2/CO2 (80:20) for 24 hours to eliminate residual methane.
- Add inoculum (300 mL) and substrate to bottle, seal with butyl rubber septa. Run in triplicate with controls (inoculum only, cellulose reference).
- Incubate at 37°C with continuous agitation.
- Monitor pressure increase. Sample headspace gas regularly (e.g., days 1, 3, 7, 15, 30).
- Analyze CH4 and CO2 concentration via GC-TCD. Calculate cumulative BMP (mL CH4/g VS added).
Protocol 3.3: Closed-Loop Recycling Simulation for PLA
- Objective: Quantify molecular weight and property degradation after multiple processing cycles.
- Materials: Virgin PLA pellets, twin-screw extruder, injection molding machine, granulator.
- Method:
- Process virgin PLA (Cycle 0) via extrusion at 200°C and injection mold into tensile bars.
- Grind tensile bars into flakes using a granulator.
- Dry flakes at 60°C in a vacuum oven for 4 hours.
- Repeat steps 1-3 for 5 cycles.
- After each cycle, characterize: Melt Flow Index (ASTM D1238), Intrinsic Viscosity (ISO 1628-5), and tensile properties (ISO 527-2). Use GPC for Mn and Mw analysis.
Visualization of EoL Decision Pathways & Experimental Workflows
EoL Decision Logic for Biopolymer Articles
Biodegradation Test Protocol Workflow
The Scientist's Toolkit: Key Research Reagent Solutions
Table 3: Essential Materials for EoL Experimentation
| Item Name / Kit | Supplier Example | Function in EoL Research |
|---|---|---|
| ANSCOMB Respirometer System | Bioscience Inc. | Automated, continuous measurement of CO2 evolution in composting biodegradability tests (ISO 14855). |
| AMPTS II (Automatic Methane Potential Test System) | Bioprocess Control | Automated BMP assay for anaerobic digestion studies, measuring volume and composition of biogas. |
| Microcrystalline Cellulose (Avicel PH-105) | Sigma-Aldrich | Positive control reference material in both composting and AD biodegradation experiments. |
| Anaerobic Sludge Inoculum | Local WWTP / ATCC | Active microbial consortium for initiating and standardizing anaerobic digestion assays. |
| NIR Polymer Sorting Calibration Set | TOMRA Sorting GmbH | Certified polymer flake samples for calibrating Near-Infrared sensors in recycling stream simulation. |
| GPC/SEC Standards (Polystyrene, PLA) | Agilent Technologies | Narrow molecular weight distribution standards for characterizing polymer degradation after recycling. |
| Soxhlet Extraction Apparatus | Glassware Suppliers | For extracting and quantifying residual additives or drug compounds from compost, digestate, or recycled polymer. |
| TOC-L Analyzer with SSM Module | Shimadzu | Precisely measures total organic carbon content in solid and liquid samples (compost, digestate, leachate). |
Within the broader thesis on the Life Cycle Assessment (LCA) of Biopolymer Production Research, a critical methodological bifurcation exists: Attributional LCA (ALCA) and Consequential LCA (CLCA). This guide examines their application in assessing biopolymers, with a specific focus on CLCA's capacity to model market-shift effects—system-wide changes triggered by increased biopolymer adoption. For researchers, scientists, and drug development professionals, understanding this distinction is paramount for evaluating the true net environmental impact of substituting conventional petroleum-based polymers with bio-based alternatives in applications ranging from packaging to medical devices.
Core Conceptual Framework
Attributional LCA (ALCA) aims to describe the environmentally relevant physical flows to and from a life cycle of a product system. It attributes a share of the global environmental burden to the product, using static, average data for supply chains (e.g., average grid electricity). It is a descriptive, snapshot approach.
Consequential LCA (CLCA) aims to describe how environmentally relevant flows will change in response to possible decisions. It uses marginal data (e.g., the electricity source that would be activated or deactivated by a change in demand) and models economic causality, including market-shift effects like substitution, rebound effects, and indirect land use change (iLUC). It is a change-oriented, dynamic approach.
For biopolymers, the key distinction lies in modeling the consequences of increased demand:
- ALCA: Assesses the footprint of producing 1 kg of polylactic acid (PLA).
- CLCA: Assesses the net change in the global system caused by deciding to produce and use 1 kg of PLA instead of 1 kg of polyethylene (PE).
Quantitative Data Comparison: ALCA vs. CLCA for Biopolymers
The following tables summarize core differences and illustrative quantitative findings from recent literature. Data is synthesized from current research (2023-2024) on common biopolymers like PLA and Polyhydroxyalkanoates (PHA).
Table 1: Methodological Comparison
| Aspect | Attributional LCA (ALCA) | Consequential LCA (CLCA) |
|---|---|---|
| Goal | Describe impacts of a system. Account for its total, attributable burdens. | Describe consequences of a decision. Estimate net change in global impacts. |
| System Modeling | Static, linear. Uses strict co-product allocation (mass, economic). | Dynamic, non-linear. Uses system expansion/substitution to handle co-products. |
| Data Type | Average (e.g., average grid mix, average agricultural practices). | Marginal (e.g., long-run marginal electricity supplier, affected agricultural frontier). |
| Market Interactions | Excluded. Treats system as independent. | Core element. Models market equilibrium shifts, price effects, substitution. |
| Key Biopolymer Relevance | Provides a baseline footprint for a "green" material. | Answers if large-scale adoption truly reduces global fossil carbon emissions. |
Table 2: Illustrative Impact Results (GWP, kg CO₂-eq/kg polymer)
| Polymer | ALCA Result (Cradle-to-Gate) | Key Assumptions | CLCA Result (with market effects) | Key Market Effects Modeled |
|---|---|---|---|---|
| PLA (corn-based) | 1.2 - 2.5 | Average US corn, average grid, mass allocation. | -0.5 to +3.0 | Marginal electricity (coal/natural gas), iLUC from expanded corn demand, displaced PE production. |
| PHA (sugarcane) | 0.8 - 2.0 | Average Brazilian sugarcane, bagasse credits allocated. | -2.0 to +1.5 | Marginal sugarcane expansion into pastureland (carbon stock change), displaced PP market share. |
| Fossil PE (Reference) | 1.8 - 2.2 | Average ethylene cracker data. | N/A (Used as counterfactual) | N/A |
Note: Ranges reflect variability in system boundaries, geographical context, and modeling choices. CLCA ranges are significantly wider due to uncertainty in marginal data and economic elasticities.
Experimental & Modeling Protocols for Consequential LCA
Conducting a CLCA for biopolymers involves integrated environmental and economic modeling.
Protocol 4.1: Defining the Decision and Affected Markets
- Decision Scenario: Precisely define (e.g., "A 10% increase in demand for PLA in flexible packaging in the EU by 2030").
- Identify Affected Markets: Determine which product systems are constrained (supply-limited) or unconstrained. For biopolymer feedstocks (e.g., corn, sugarcane), this often involves agricultural commodity markets.
- Determine Marginal Suppliers: Use economic equilibrium models or literature-based elasticity parameters to identify which producers will expand (long-run marginal suppliers) to meet the new demand.
Protocol 4.2: Modeling Indirect Land Use Change (iLUC) A critical protocol for bio-based materials.
- Link to Agricultural Margins: Connect increased feedstock demand to the type of land likely to be converted at the margin (e.g., forest, grassland).
- Use iLUC Models: Employ models like GTAP-AEZ or CGOM to estimate the geographical extent and type of land conversion.
- Calculate Carbon Stock Change: Apply IPCC-tier emission factors to the converted land area to estimate the CO₂ emissions from iLUC.
- Allocate iLUC Emissions: Allocate the total iLUC burden to the initiating product (e.g., per kg of PLA) based on causal contribution.
Protocol 4.3: System Expansion for Co-Products
- Identify Co-Products: In biorefineries, identify all outputs (e.g., PLA, distillers' grains, bagasse electricity).
- Define Displaced Products: Determine which products in the market are likely to be displaced by these co-products (e.g., soybean meal displaced by distillers' grains in animal feed).
- Credit the System: Subtract the environmental burden of producing the displaced product from the total biorefinery burden. This avoids allocation.
Protocol 4.4: Integrating Economic Partial Equilibrium Modeling
- Define Price Elasticities: Gather data for supply/demand elasticities for the biopolymer, its feedstock, and the displaced fossil polymer.
- Run Scenario Analysis: Use software (e.g., GAMS, partial equilibrium models) to simulate the market response to the defined decision.
- Iterate with LCA: Feed the quantitative output of the market model (e.g., kg of additional corn, kg of displaced PE, hectares of land converted) into the LCA inventory.
Diagrams of Methodological Workflows
ALCA Linear Modeling Workflow
CLCA System Change Workflow
Indirect Land Use Change (iLUC) Causality
The Scientist's Toolkit: Key Research Reagent Solutions
Table 3: Essential Tools for Conducting Consequential LCA on Biopolymers
| Tool / Reagent Category | Specific Example(s) | Function / Explanation |
|---|---|---|
| LCA Database & Software | Ecoinvent v3.8+ (with consequential datasets), Sphera, OpenLCA | Provides core life cycle inventory (LCI) data. Consequential databases include marginal market data. Software enables modeling. |
| Economic Equilibrium Model | GTAP (Global Trade Analysis Project), CGOM (Common Agricultural Policy Regional Impact Model) | Models global trade and land use changes to provide quantitative inputs (e.g., hectares converted) for iLUC calculations. |
| Bio-LCA Specific Databases | USDA LCA Commons, Agribalyse, Bioenergies LCA data | Provides region-specific agricultural practice data for key biopolymer feedstocks (corn, sugarcane, etc.). |
| Impact Assessment Method | IPCC 2021 GWP, ReCiPe 2016 (Midpoint/H), EF 3.0 | Translates inventory flows (kg CO2, kg PO4-eq) into impact category scores like Global Warming Potential or Eutrophication. |
| Elasticity Parameter Repository | Academic literature meta-analyses, USDA Economic Research Service reports | Provides critical supply/demand price elasticities needed to model market responses in CLCA. |
| iLUC Calculation Tool | GREET Model (Argonne National Laboratory), Biograce iLUC Tool | Integrated models that streamline iLUC emission calculations for bio-based products. |
| Uncertainty/Sensitivity Analysis Software | @RISK (for Excel), Monte Carlo simulation in OpenLCA | Crucial for quantifying and communicating the high uncertainty inherent in CLCA results. |
Biopolymer LCA in Action: Comparative Studies, Benchmarks, and Certification
This whitepaper provides an in-depth technical guide within the broader thesis on Life Cycle Assessment (LCA) of biopolymer production research. It presents a comparative LCA of four major biopolymer categories: Polylactic Acid (PLA), Polyhydroxyalkanoates (PHA), Starch-Based Polymers, and Cellulose Derivatives. The analysis follows ISO 14040/14044 standards, evaluating environmental impacts from cradle-to-gate and, where data permits, cradle-to-grave.
Goal and Scope Definition
- Goal: To quantify and compare the environmental profiles of the major biopolymers to inform sustainable material selection for researchers and industry professionals.
- Scope: Cradle-to-gate assessment (raw material extraction to polymer pellet). System expansion includes credit for avoided fossil feedstock. Functional Unit: 1 kg of polymer. Impact categories: Global Warming Potential (GWP), Fossil Resource Scarcity (FRS), Land Use, Eutrophication.
Life Cycle Inventory (LCI) & Key Data
Primary data sourced from recent peer-reviewed LCA studies (2020-2023) and industry reports.
Table 1: Key Inventory Data per kg Polymer Production
| Biopolymer Category | Feedstock (Source) | Non-Renewable Energy Use (MJ) | Water Consumption (L) | Land Use (m²a) | Key Process Steps |
|---|---|---|---|---|---|
| PLA (Ingeo) | Corn (USA) / Sugarcane | 45 - 55 | 250 - 500 | 0.8 - 1.2 | Fermentation, Separation, Chemical Polymerization |
| PHA (mixed culture) | Sugarcane Molasses | 60 - 80 | 400 - 800 | 0.5 - 0.9 | Fermentation, Extraction (Solvent/Digestion) |
| Starch-Based (TPS/Blends) | Potato / Corn Starch | 25 - 40 | 100 - 300 | 1.0 - 1.5 | Starch Extraction, Plasticization, Extrusion |
| Cellulose Acetate | Cotton Linters / Wood Pulp | 70 - 90 | 500 - 1000 | 0.2 - 0.5 | Esterification, Hydrolysis, Precipitation |
Table 2: Comparative Impact Assessment Results (Cradle-to-Gate)
| Impact Category | Unit | PLA | PHA (from sugar) | Starch-Based | Cellulose Acetate | Fossil PE (Reference) |
|---|---|---|---|---|---|---|
| GWP (100a) | kg CO₂-eq | 1.5 - 2.5 | 2.0 - 3.5 | 0.8 - 1.8 | 3.0 - 5.0 | 1.8 - 2.3 |
| Fossil Resource Scarcity | kg oil-eq | 1.2 - 2.0 | 1.8 - 3.0 | 0.5 - 1.2 | 2.5 - 4.0 | 1.5 - 2.0 |
| Land Use | pt | 8 - 12 | 5 - 9 | 10 - 16 | 2 - 5 | ~0 |
| Freshwater Eutrophication | kg P-eq | 0.001 - 0.003 | 0.004 - 0.008 | 0.002 - 0.006 | 0.005 - 0.010 | 0.0003 - 0.0007 |
Detailed Experimental & Methodological Protocols
Protocol for Laboratory-Scale PHA Production & Analysis (Modified from M. Koller et al., 2020)
Objective: To produce and characterize PHA from a defined substrate for LCI data generation. Materials: See Reagent Solutions Table. Procedure:
- Pre-culture: Inoculate Cupriavidus necator DSM 428 in nutrient broth, incubate 24h at 30°C.
- Fermentation: Transfer to mineral salts medium with 20 g/L fructose as carbon source in a 5L bioreactor. Maintain pH 7.0, DO >30%.
- Nitrogen Limitation: After 24h growth phase, halt NH₄OH feed to induce PHA accumulation for 48h.
- Harvest: Centrifuge biomass at 10,000xg, 4°C, 20 min. Wash pellet with deionized water.
- PHA Extraction (Chloroform-based): Lyophilize biomass. Reflux with chloroform (100 mL/g biomass) for 4h at 70°C. Filter to remove cell debris.
- Precipitation: Add 3 volumes of ice-cold methanol to filtrate. Recover precipitated PHA by filtration, dry under vacuum.
- Analysis: Quantify PHA content via GC-FID after methanolysis. Determine molecular weight via GPC.
Protocol for Enzymatic Hydrolysis of Cellulose Derivatives for LCA End-of-Life Modeling
Objective: Quantify biodegradability under controlled composting conditions. Procedure:
- Prepare polymer films (100 µm thickness, 1cm² pieces).
- Inoculate 500 mL bioreactors with 200 g of mature compost (ISO 14855 standard).
- Embed polymer samples in compost matrix. Maintain at 58°C ± 2°C.
- Maintain aerobic conditions with humidified air flow (50 mL/min).
- Sample triplicate reactors weekly for 90 days.
- Recover residual polymer, wash, dry, and weigh mass loss.
- Analyze evolved CO₂ via NaOH trapping and titration to confirm mineralization.
Visualizations
The Scientist's Toolkit: Research Reagent Solutions
Table 3: Essential Reagents for Biopolymer Production & LCA Research
| Reagent / Material | Function in Research | Example Supplier / Grade |
|---|---|---|
| Chloroform (CHCl₃) | Solvent for extraction and purification of PHA and cellulose derivatives. | Sigma-Aldrich, ACS grade |
| Methanol (CH₃OH) | Anti-solvent for polymer precipitation; reagent for GC methanolysis. | Fisher Chemical, HPLC grade |
| Dichloromethane (DCM) | Solvent for casting polymer films for biodegradability testing. | Merck, Puriss. grade |
| Hexafluoroisopropanol (HFIP) | Solvent for GPC analysis of PLA and cellulose esters. | Apollo Scientific, 99%+ |
| Polystyrene Standards | Calibration standards for Gel Permeation Chromatography (GPC). | Agilent Technologies |
| Mineral Salts Medium (MSM) | Defined medium for microbial fermentation (PHA production). | Formulated per DSMZ 81 |
| Cellulase from Trichoderma reesei | Enzyme for controlled hydrolysis studies in biodegradation assays. | Sigma-Aldrich, ≥700 units/g |
| Corn Steep Liquor | Complex nitrogen source for industrial fermentation LCAs. | Sigma-Aldrich |
| Triphenyl Phosphate (TPP) | Plasticizer for cellulose acetate in material property studies. | TCI Chemicals, >99% |
| Glycerol | Plasticizer for starch-based polymers (Thermoplastic Starch). | Alfa Aesar, 99.5% |
Interpretation & Critical Discussion
Starch-based polymers often show the lowest GWP but highest land use impact. PLA offers a balanced profile but is sensitive to grid electricity source. PHA's impact is heavily tied to fermentation efficiency and extraction solvent recovery. Cellulose derivatives, while from abundant feedstock, have high chemical-related impacts. End-of-life scenarios (industrial composting, anaerobic digestion) significantly alter rankings, emphasizing the need for system expansion in LCA. Data quality and allocation methods (e.g., mass vs. economic for co-products) remain key uncertainties.
This technical whitepaper provides a nuanced comparison of biopolymers (e.g., Polylactic Acid - PLA, Polyhydroxyalkanoates - PHA) and conventional polymers (Polypropylene - PP, Polyethylene Terephthalate - PET). The analysis is framed within the broader thesis of Life Cycle Assessment (LCA) research, which seeks to quantify the environmental, economic, and technical trade-offs from cradle-to-grave. For researchers in material science and drug development, understanding these trade-offs is critical for selecting polymers for applications ranging from labware to controlled-release drug delivery systems.
Table 1: Key Material Properties & Performance Trade-offs
| Property | Polypropylene (PP) | Polyethylene Terephthalate (PET) | Polylactic Acid (PLA) | Polyhydroxyalkanoates (PHA) |
|---|---|---|---|---|
| Tensile Strength (MPa) | 25-40 | 55-75 | 50-70 | 20-40 |
| Glass Transition Temp. (Tg, °C) | -10 to 0 | 70-80 | 55-60 | 0-20 |
| Degradation Time (Typical) | Centuries | Centuries | 6 mo - 2 yrs (Industrial Compost) | 3-9 mo (Marine/Soil) |
| Permeability to O₂ (cm³·mm/m²·day·atm) | ~500 | ~6 | ~150 | 10-20 |
| Maximum Continuous Use Temp. (°C) | 100-120 | 65-80 | 50-55 | < 50 |
Table 2: LCA Phase Impact Highlights (Per kg polymer)
| Impact Category | PP (Fossil-based) | PET (Fossil-based) | PLA (Corn-based) | PHA (Sugarcane) |
|---|---|---|---|---|
| Global Warming Potential (kg CO₂ eq) | 1.7 - 3.5 | 2.7 - 4.2 | 0.8 - 2.5 | 0.5 - 3.0* |
| Fossil Resource Use (MJ) | 70 - 85 | 70 - 90 | 20 - 50 | 10 - 40 |
| Land Use (m²a crop eq) | Negligible | Negligible | 0.5 - 2.0 | 1.0 - 4.0 |
| Eutrophication Potential (g PO₄³⁻ eq) | Low | Low | Medium-High (Fertilizer Runoff) | Medium |
*Highly dependent on feedstock and fermentation efficiency.
Experimental Protocols for Key LCA & Performance Assessments
Protocol 1: Standardized Biodegradation Testing (ASTM D5338)
- Objective: Quantify aerobic biodegradation under controlled composting conditions.
- Methodology:
- Sample Preparation: Granulate polymer samples to < 250µm. Use 10g test material mixed with 600g of mature, inoculum compost.
- Reactor Setup: Place mixture in a 2L respirometer vessel maintained at 58°C ± 2°C.
- Measurement: Continuously monitor CO₂ evolution via an alkaline trap (NaOH) and subsequent titration, or via direct infrared gas analysis.
- Control: Run blank (compost only) and positive control (cellulose) vessels in parallel.
- Calculation: Biodegradation (%) = [(CO₂ from test) - (CO₂ from blank)] / (Theoretical CO₂ of test material) x 100.
Protocol 2: Hydrolytic Degradation Kinetics for Drug Delivery Applications
- Objective: Model drug release profiles by characterizing polymer hydrolysis.
- Methodology:
- Film Fabrication: Solution-cast thin films (100-200 µm) of the polymer (e.g., PLA, PHA).
- Immersion Study: Immerse pre-weighed films (n=5) in phosphate-buffered saline (PBS) at pH 7.4, 37°C. Maintain sink conditions.
- Sampling: At predetermined intervals, remove samples, dry to constant weight, and analyze.
- Analysis:
- Mass Loss: Gravimetric analysis.
- Molecular Weight Change: Gel Permeation Chromatography (GPC).
- Morphology Change: Scanning Electron Microscopy (SEM).
- Kinetic Modeling: Fit data to models (e.g., first-order, Higuchi) to predict degradation and drug release rates.
Visualizations of Key Processes & Workflows
Diagram 1: LCA System Boundaries for Polymer Comparison
Diagram 2: Hydrolytic Degradation Pathways
The Scientist's Toolkit: Key Research Reagent Solutions
Table 3: Essential Materials for Polymer LCA & Degradation Research
| Item | Function in Research | Example/Note |
|---|---|---|
| Controlled Compost Inoculum | Provides standardized microbial community for biodegradation tests (ASTM D5338). | Mature compost from biowaste, certified for testing. |
| Phosphate Buffered Saline (PBS) | Simulates physiological conditions for hydrolytic degradation studies of medical polymers. | pH 7.4, 0.01M, sterile filtered. |
| Tetrahydrofuran (THF) or Chloroform | Solvents for GPC sample preparation to determine molecular weight distribution. | HPLC/ GPC grade, with stabilizers as needed. |
| Cellulose Positive Control | Reference material to validate activity of biodegradation test systems. | Microcrystalline cellulose, ~50µm powder. |
| Enzymatic Cocktails (Lipase, Protease, Esterase) | Used to study enzymatic degradation pathways specific to biopolymers (e.g., PHA, PLA). | Isolated from specific fungi or bacteria. |
| Isotopically Labeled Substrates (¹³C-Glucose) | Tracks carbon fate in fermentation LCA studies for biopolymer production. | Tracer for metabolic flux analysis in PHA production. |
1. Introduction: The Problem of Disparity in Biopolymer LCA Life cycle assessment (LCA) is the cornerstone of evaluating the environmental sustainability of biopolymers. However, researchers and industry professionals are often confronted with contradictory LCA findings. One study may declare a biopolymer (e.g., polylactic acid, PLA) as carbon-negative, while another finds its global warming potential comparable to fossil-based plastics. These conflicts frequently stem not from data errors but from legitimate differences in methodological assumptions and regional contexts. This guide, framed within broader thesis research on LCA of biopolymer production, deconstructs these sources of variability to equip scientists with tools for critical appraisal.
2. Deconstructing Key Assumptions: A Quantitative Analysis The following assumptions are primary levers influencing LCA outcomes. Their variability across studies is summarized in Table 1.
Table 1: Influence of Common LCA Assumptions on Biopolymer Impact Results
| Assumption Category | Typical Range in Literature | Impact on GWP (Example: PLA) | Rationale & Data Source (Recent Findings) |
|---|---|---|---|
| System Boundary | Cradle-to-Gate vs. Cradle-to-Grave | ± 40-60% | End-of-life (landfill, composting, incineration) emissions are highly scenario-dependent. A 2023 review highlighted that including composting can turn net carbon storage into a net emission if methane slip occurs. |
| Allocation Method | Mass vs. Economic vs. System Expansion | ± 20-50% | For corn-based PLA, allocating burdens between polylactide and co-products (animal feed, corn oil) changes per-kg PLA impacts. System expansion (avoided burden) often yields the most favorable results. |
| Temporal Boundary (Carbon) | 20-yr vs. 100-yr GWP (GWP20/GWP100) | GWP20 can be 2-4x GWP100 for biogenic CH₄ | Critical for biopolymers degrading in landfills (generating methane). A 2024 study on PHA showed GWP20 impacts 3.2x higher than GWP100 under anaerobic digestion scenarios. |
| Energy Mix in Production | EU grid vs. China grid vs. 100% Renewable | ± 30-80% | The carbon intensity of electricity for fermentation and polymerization is dominant. Using 2022 IEA data, PLA produced with Chinese coal-based grid has ~70% higher GWP than with Nordic hydro-based grid. |
| Land Use Change (LUC) | Included (iLUC) vs. Excluded | Can swing GWP from negative to > PE | Attribution of deforestation or land conversion to feedstock cultivation. Models like GLOBIOM 2023 show iLUC emissions for sugarcane-based biopolymers can add 2-4 kg CO₂-eq/kg polymer. |
| Data Quality | Industry-specific vs. Generic (Ecoinvent) | ± 15-35% | Primary data from modern biorefineries vs. outdated or averaged database entries. A 2023 LCA of novel PBS used primary data showing 25% lower energy use than database defaults. |
3. The Critical Role of Regional Factors Regional variability introduces geographical specificity that generic assessments miss. Key factors are compared in Table 2.
Table 2: Regional Variability Factors and Their Quantitative Influence
| Regional Factor | Geographic Examples | Potential Magnitude of Effect | Underlying Cause |
|---|---|---|---|
| Agricultural Practices | US Corn Belt (high-yield, irrigated) vs. SE Asia Cassava (lower yield, rain-fed) | Feedstock cultivation GWP varies by up to 300% | Fertilizer use, irrigation energy, yield per hectare, and soil N₂O emission factors. |
| Grid Electricity Carbon Intensity | France (~50 g CO₂-eq/kWh nuclear) vs. India (~700 g CO₂-eq/kWh coal-heavy) | Polymerization stage GWP varies by ~500% | National energy infrastructure and fuel mix. Directly affects compression, extrusion, and heating processes. |
| Transport Logistics | Localized biorefinery vs. Global feedstock & product shipping | Contributes 5-25% to total GWP | Distance, mode (ship, rail, truck), and infrastructure efficiency. |
| End-of-Life Infrastructure | High EU incineration with energy recovery vs. Informal landfilling in developing regions | End-of-life GWP can vary by an order of magnitude | Technology (capture rates), regulation, and societal practices dictate methane release and displacement credits. |
| Water Scarcity & Irrigation | Water-stressed vs. Water-abundant regions | Water depletion impact can be negligible or catastrophic | Regional water stress indices dramatically alter the weighting of water consumption in cultivation. |
4. Experimental Protocols for Resolving Conflicts To move from conflicting results to robust conclusions, standardized investigative protocols are essential.
Protocol 1: Sensitivity Analysis on Key Parameters
- Objective: Quantify the influence of each major assumption on the final LCA result.
- Methodology:
- Establish a baseline model using a consistent set of moderate assumptions (e.g., cradle-to-grave, economic allocation, 100-yr GWP).
- Vary one parameter at a time across its plausible range (e.g., change allocation from economic to mass to system expansion).
- Calculate the percentage change in the selected impact category (e.g., GWP, eutrophication) for each variation.
- Plot tornado diagrams to visually identify the most sensitive parameters driving result variability.
Protocol 2: Regional Scenario Modeling
- Objective: Isolate the effect of geography on LCA outcomes for the same biopolymer.
- Methodology:
- Define two to three distinct geographical scenarios for producing 1 kg of biopolymer (e.g., PLA from US corn, PLA from Thai cassava, PLA from EU sugar beet).
- For each scenario, use region-specific data for: a) Crop yield and agro-chemical inputs, b) Average grid electricity mix, c) Modal transport distances to a common point of use, d) Predominant end-of-life pathway.
- Model each scenario using otherwise identical system boundaries and allocation methods.
- Compare results to identify which regional factors cause the largest divergences.
Protocol 3: Data Pedigree Matrix Assessment
- Objective: Evaluate the robustness of input data used in conflicting studies.
- Methodology:
- For each critical data input (e.g., fermentation energy, enzyme dosage, polymerization yield), create a pedigree matrix.
- Score data from each compared study based on: Reliability (source verification), Temporal Correlation (data age), Geographical Correlation, Technological Correlation.
- Apply weighting factors and aggregate scores to assign an overall data quality indicator (DQI) for each study's core inventory.
- Use DQI to contextualize and explain differences in LCA outcomes.
5. Visualizing the Decision Framework
Diagram 1: LCA Conflict Resolution Workflow (Max width: 760px)
6. The Scientist's Toolkit: Key Research Reagent Solutions Essential materials and tools for conducting rigorous, comparable biopolymer LCAs.
| Research Reagent / Tool | Function & Explanation |
|---|---|
| LCA Software (e.g., openLCA, SimaPro, GaBi) | Core modeling platform to build inventory, apply impact assessment methods, and perform calculations. Enables scenario comparison. |
| Agri-LCA Databases (e.g., Agribalyse, USDA databases) | Provide region-specific lifecycle inventory data for agricultural feedstocks (corn, sugarcane, etc.), including fertilizer, pesticide, water, and land use. |
| Energy Mix Datasets (e.g., IEA, Ecoinvent market processes) | Critical for modeling the carbon intensity of electricity and heat used in biopolymer processing stages. Must be geographically resolved. |
| Biogenic Carbon Models | Tools (often integrated into software) to track biogenic CO₂ uptake and release, and model different end-of-life fates (degradation rates, methane yields). |
| Sensitivity & Uncertainty Analysis Modules | Built-in or add-on tools to systematically vary parameters (Monte Carlo, perturbation) and quantify output uncertainty, as per Protocol 1. |
| Pedigree Matrix & DQI Templates | Standardized spreadsheets or checklists to systematically document and score data quality, ensuring transparency and enabling Protocol 3. |
| Regionalized Impact Assessment Methods (e.g., ReCiPe, TRACI) | Impact assessment methods that include geographically differentiated characterization factors (e.g., for water scarcity or eutrophication). |
| Primary Data Collection Kits | Protocols for gathering primary data from fermentation pilots or biorefineries: energy loggers, material flow tracking software, lab-scale biodegradation test kits. |
This case study is an integral component of a broader thesis on Life cycle assessment of biopolymer production research. It applies the LCA framework to evaluate the environmental impacts of polyhydroxyalkanoate (PHA)-based absorbable sutures versus conventional alternatives, providing a concrete application of LCA methodology in biomedical product development. The findings contribute to the thesis's overarching goal of establishing standardized, comparative sustainability metrics for biopolymer synthesis and application pathways.
Product Definition & Goal
- Product System: Sterile, size 4-0, monofilament absorbable suture.
- Comparative Scenarios:
- Scenario A (Innovative): Suture produced from poly(3-hydroxybutyrate-co-3-hydroxyvalerate) (PHBV) via bacterial fermentation using waste cooking oil as a primary carbon source.
- Scenario B (Conventional): Suture produced from fossil-based polyglycolic acid (PGA).
- Functional Unit: 1 meter of suture providing adequate tensile strength for dermal closure over a critical 21-day post-operative healing period.
- System Boundaries: Cradle-to-grave, including raw material extraction, biopolymer production, suture manufacturing, sterilization, packaging, transportation, clinical use, and end-of-life (incineration with energy recovery or landfill).
Life Cycle Inventory (LCI) & Quantitative Data
Data compiled from recent peer-reviewed LCA studies (2021-2024), patent filings, and manufacturer EPDs (Environmental Product Declarations). Primary data sources were simulated process models (Aspen Plus) scaled to pilot-scale production volumes.
Table 1: Key Inventory Data per Functional Unit (1 meter of suture)
| Life Cycle Stage | Parameter | Scenario A: PHBV Suture | Scenario B: PGA Suture | Data Source / Notes |
|---|---|---|---|---|
| Raw Material & Production | Primary Feedstock | Waste Cooking Oil (2.1 g) | Crude Oil (1.8 g) | Allocated burdens for waste oil collection. |
| Water Consumption (L) | 12.5 | 8.2 | High water use in fermentation and downstream processing for PHBV. | |
| Energy Input (MJ) | 1.85 | 1.42 | PHBV: Mix of grid electricity and biogas from waste. PGA: Natural gas. | |
| Solvent Use (g, Chloroform) | 0.15 | 0.0 | Used in PHBV extraction. Closed-loop recovery modeled at 85%. | |
| Manufacturing & Sterilization | Process Energy (MJ) | 0.75 | 0.68 | Spinning, drawing, coating, and packaging. |
| Sterilization Method | Gamma Irradiation | Ethylene Oxide (EtO) | EtO emissions and aeration energy included for PGA. | |
| End-of-Life (Modeled) | Incineration with Energy Recovery | -0.3 MJ (credit) | -0.4 MJ (credit) | Net caloric value credited. Biogenic carbon for PHBV considered neutral. |
| Landfill (Fraction modeled) | 0% | 30% | PHBV assumed 100% industrial compostable; real-world disposal varies. |
Table 2: Impact Assessment Results (ReCiPe 2016 Midpoint - H)
| Impact Category | Unit | Scenario A: PHBV Suture | Scenario B: PGA Suture | % Difference (A vs. B) |
|---|---|---|---|---|
| Global Warming Potential | kg CO₂ eq | 0.105 | 0.141 | -25.5% |
| Fossil Resource Scarcity | kg oil eq | 0.028 | 0.051 | -45.1% |
| Water Consumption | m³ | 1.65E-03 | 1.02E-03 | +61.8% |
| Terrestrial Ecotoxicity | kg 1,4-DCB | 0.85 | 1.92 | -55.7% |
| Human Carcinogenic Toxicity | kg 1,4-DCB | 0.012 | 0.089 | -86.5% |
Experimental Protocols for Key Cited Studies
Protocol 1: Lab-Scale PHBV Fermentation & Extraction (Adapted from recent research)
- Microorganism & Preculture: Cupriavidus necator DSM 428 is inoculated in a mineral salts medium with 10 g/L fructose and incubated (30°C, 200 rpm, 24h).
- Fermentation: Bioreactor (5L working volume) is charged with mineral salts medium. Sterilized waste cooking oil (20 g/L) is added as the sole carbon source. The reactor is inoculated (10% v/v) and maintained at 30°C, pH 6.8, with dissolved oxygen >30%. Nitrogen limitation is induced after 24h to trigger PHA accumulation.
- Harvesting: After 72h, cells are harvested via centrifugation (8000 x g, 15 min, 4°C).
- PHA Extraction (Solvent-Based): Cell pellet is lyophilized. Dry biomass is stirred with refluxing chloroform (1:10 w/v) for 4h. The mixture is filtered to remove cell debris. PHBV is recovered by precipitating the filtrate into 10 volumes of cold methanol, followed by filtration and vacuum drying.
- Characterization: PHA content (%) is determined by GC-FID after methanolysis. Monomer composition (HB:HV) is analyzed via NMR.
Protocol 2: In Vitro Degradation & Cytocompatibility Testing (ASTM/ISO based)
- Sample Preparation: PHBV and PGA sutures are cut into 10 mm lengths, sterilized (gamma, 25 kGy), and weighed (initial mass, W₀).
- Degradation Study: Samples (n=6 per material per time point) are immersed in 5 mL of phosphate-buffered saline (PBS, pH 7.4) or simulated body fluid (SBF) at 37°C under gentle agitation. The medium is refreshed weekly.
- Analysis: At pre-defined intervals (1, 3, 6, 12 weeks), samples are removed, rinsed, dried to constant weight (Wₜ), and analyzed. Mass loss (%) = [(W₀ - Wₜ)/W₀] x 100. Surface morphology is examined via SEM. Molecular weight is tracked via GPC.
- Cytocompatibility (ISO 10993-5): Extract assay performed. Sutures are incubated in cell culture medium (37°C, 72h) to prepare extracts. L929 fibroblasts are exposed to 100% extract for 24h. Viability is assessed using the MTT assay. Relative viability >70% vs. control is considered non-cytotoxic.
Visualizations
LCA Framework & System Boundary Diagram
Comparative LCA Results: PHBV vs. PGA Sutures
The Scientist's Toolkit: Research Reagent Solutions
Table 3: Key Reagents & Materials for PHA Suture LCA Research
| Item | Function in Research | Example/Note |
|---|---|---|
| Modified Mineral Salts Medium (MSM) | Provides essential nutrients (N, P, K, Mg, trace elements) for bacterial growth while allowing nitrogen limitation for PHA induction. | Standard composition with (NH₄)₂SO₄ as N-source. |
| Waste Cooking Oil (Pre-treated) | Low-cost, renewable carbon source for microbial PHA production. Requires filtration and sterilization. | Characterized for fatty acid profile (C16, C18). |
| Cupriavidus necator (DSM 428) | Robust, genetically tractable bacterial strain with high PHA accumulation capacity. | Type strain available from culture collections. |
| Chloroform (ACS grade) | Primary solvent for efficient extraction of PHA from bacterial biomass at lab scale. | Requires strict safety controls; closed-loop recovery systems are studied for LCA. |
| Simulated Body Fluid (SBF) | Buffered ionic solution mimicking human blood plasma for in vitro degradation studies. | Prepared per Kokubo recipe; pH closely monitored. |
| MTT Reagent (3-(4,5-dimethylthiazol-2-yl)-2,5-diphenyltetrazolium bromide) | Yellow tetrazole reduced to purple formazan by living cell mitochondria, enabling cytotoxicity quantification. | Used per ISO 10993-5 for extract testing. |
| Size-0, 3/8 Circle Taper Point Needle | Standardized needle for consistent in vivo implantation studies in animal models (e.g., rat subdermal). | Critical for evaluating functional performance (tissue drag, strength retention). |
| Life Cycle Inventory (LCI) Database | Source of secondary data for energy grids, chemical production, transport, and waste processing. | Ecoinvent v3.9 or GREET 2023 used to model background processes. |
Within the rigorous framework of life cycle assessment (LCA) research for biopolymer production, sustainability reporting is a critical output. However, the credibility of self-declared environmental claims is often questioned by the scientific community, including researchers and drug development professionals utilizing these materials. Third-party verification and standardized eco-labels serve as essential mechanisms to ensure methodological integrity, data accuracy, and comparability of findings, thereby supporting reliable decision-making in downstream applications.
The Role of Third-Party Verification in LCA for Biopolymers
Third-party verification involves an independent assessment of an LCA study or sustainability report against a recognized standard. For biopolymer production research, this process validates the inventory analysis, impact assessment methods, and interpretation phases.
Core Verification Standards:
- ISO 14044:2006: Provides the foundational framework and requirements for conducting LCA.
- ISO 14025:2006: Principles and procedures for Type III environmental declarations (EPDs).
- ISO 14040:2006: Principles and framework for LCA.
A verified LCA must transparently document all critical methodological choices, which are summarized in Table 1.
Table 1: Critical LCA Methodological Choices Requiring Verification in Biopolymer Research
| Choice Category | Specific Parameter | Verified Requirement | Common Standard/Data Source |
|---|---|---|---|
| Goal & Scope | Functional Unit | Clearly defined, measurable, and comparable (e.g., 1 kg of polymer resin). | ISO 14044 |
| System Boundary | Cradle-to-gate vs. cradle-to-grave; inclusion of biogenic carbon, land use change. | ISO 14044 | |
| Life Cycle Inventory (LCI) | Data Quality | Age, geographical & technological representativeness; use of secondary data sources. | Ecoinvent, USDA LCA Commons |
| Allocation Procedures | Mass, economic, or energy-based allocation for co-products (e.g., lignin, bagasse). | ISO 14044 | |
| Life Cycle Impact Assessment (LCIA) | Impact Categories | Relevance to biopolymers (GWP, eutrophication, acidification, land use). | ReCiPe, TRACI methodologies |
| Interpretation | Uncertainty Analysis | Use of Monte Carlo simulation or sensitivity analysis to quantify data variability. | ISO 14040/44 |
Eco-Labels as Communicative Tools
Eco-labels translate complex LCA results into accessible claims. For researchers, understanding the criteria behind a label is essential to assess material suitability.
Key Eco-Label Typology for Biopolymers:
- Type I (ISO 14024): Multi-criteria, pass/fail labels awarded by an independent party (e.g., EU Ecolabel, Nordic Swan).
- Type II (ISO 14021): Self-declared environmental claims (e.g., "compostable," "biobased content"). Require robust internal verification.
- Type III (ISO 14025): Quantified environmental data presented in a standardized format (Environmental Product Declaration - EPD).
Table 2: Comparative Analysis of Select Eco-Labels Relevant to Biopolymers
| Eco-Label | Type | Key Criteria for Biopolymers | Verification Body | Relevance to Research |
|---|---|---|---|---|
| EU Ecolabel | Type I | Restrictions on hazardous substances, energy use, & waste generation in production. | Competent Body of member state (e.g., ADEME in France). | Ensures baseline environmental & health safety for lab use. |
| OK compost INDUSTRIAL (TÜV Austria) | Type II | Proof of complete biodegradation in industrial composting plants within 12 weeks. | TÜV Austria | Critical for studies on end-of-life scenarios and biodegradation kinetics. |
| USDA Certified Biobased Product | Type II | Minimum percentage of biobased carbon content verified via ASTM D6866. | USDA | Provides certified biobased carbon data for carbon footprint studies. |
| Environmental Product Declaration (EPD) | Type III | Full LCA results according to a Product Category Rule (PCR). | Independent verifier (e.g., UL Solutions) | Provides peer-reviewed, standardized LCA data for comparative assertions. |
Experimental Protocols for Key Verification Tests
1. Protocol: Verification of Biobased Carbon Content (ASTM D6866)
- Principle: Measures the
^14^C/^12^Cratio via Accelerator Mass Spectrometry (AMS) to distinguish biogenic carbon from fossil carbon. - Sample Preparation: Precisely weigh 1-3 mg of homogenized biopolymer sample into a pre-cleaned quartz combustion tube. Add excess copper oxide (CuO) and silver wire (to remove sulfur/halides).
- Combustion & Reduction: Seal tube under vacuum (~10^-5 Torr) and combust at 900°C for 2 hours. Manometrically quantify the evolved CO~2~. Reduce CO~2~ to graphite using hydrogen with an iron/zinc catalyst at 550°C.
- AMS Analysis: Press graphite into a cathode for the ion source. The AMS system measures the
^14^C/^12^Cratio, comparing it to a modern carbon reference standard (Oxalic Acid II). The fraction of modern carbon (Fm) is calculated. - Calculation: % Biobased Carbon = (Fm~sample~ / Fm~reference~) * 100. Correct for the atmospheric
^14^Clevel of the year of biomass growth if known.
2. Protocol: Aerobic Biodegradation in Industrial Composting (ISO 14855-1)
- Principle: Measures the cumulative evolution of CO~2~ from test material in a controlled composting environment.
- Reactor Setup: Use at least 3 replicates. Prepare mature, stabilized compost inoculum (particle size <10mm). Mix test material (approx. 100g, known dry mass) with inoculum at a recommended C:N ratio of 40:1 in a bioreactor (2-5L). Use cellulose as a positive control and a negative control (inoculum only).
- Conditions: Maintain at 58°C ± 2°C. Aerate with CO~2~free, humidified air at a constant rate (e.g., 50 mL/min). Pass exhaust gas through trapping vessels.
- CO~2~ Trapping & Titration: Bubble exhaust gas through 0.1-0.5N Ba(OH)~2~ or NaOH solution. Titrate the remaining alkali with HCl at defined intervals (e.g., daily for first 10 days, then less frequently) to quantify trapped CO~2~.
- Calculation: Cumulative CO~2~ evolution is plotted. Percentage biodegradation = [(CO~2~)~Test~ - (CO~2~)~Negative Control~] / (Theoretical CO~2~ of test material) * 100. The test is valid if cellulose degradation is >70% after 45 days.
Signaling Pathway: The Verification Ecosystem for Credible Reporting
Title: The Verification Pathway from LCA to Credible Claims
Workflow: Integrating Verification into Biopolymer LCA Research
Title: LCA Research Workflow with Critical Verification Step
The Scientist's Toolkit: Key Research Reagent Solutions
Table 3: Essential Materials for Verification & Analysis in Biopolymer Sustainability Research
| Item / Reagent | Function / Application | Example Use-Case |
|---|---|---|
| Reference Biopolymer (Cellulose) | Positive control material for biodegradation testing (ISO 14855). | Calibrating compost bioreactor activity; validating experimental setup. |
| Oxalic Acid II (NIST SRM 4990C) | Modern carbon standard for AMS radiocarbon analysis (ASTM D6866). | Calibrating the AMS for accurate fraction of modern carbon (Fm) measurement. |
| Stabilized Compost Inoculum | Defined microbial community for biodegradation tests. | Providing a reproducible biological environment for composting experiments. |
| CO~2~ Trapping Solution (0.1N Ba(OH)~2~) | Quantitative absorption of evolved carbon dioxide. | Trapping CO~2~ from biodegradation reactors for subsequent titrimetric analysis. |
| Elemental Analyzer (CHNS/O) | Determines carbon, hydrogen, nitrogen content of samples. | Calculating the theoretical CO~2~ potential and C:N ratio for biodegradation tests. |
| LCIA Database (e.g., Ecoinvent) | Secondary data for background processes (electricity, chemicals). | Building life cycle inventory when primary data is unavailable. |
| Uncertainty Analysis Software (@Risk, openLCA) | Performs Monte Carlo simulation and sensitivity analysis. | Quantifying and propagating data uncertainty in LCA results (ISO requirement). |
For the LCA research community focused on biopolymer production, third-party verification and a critical understanding of eco-labels are not merely administrative tasks but core components of scientific rigor. They transform subjective environmental claims into objective, comparable, and reliable data. This credibility is paramount for drug development professionals and scientists who depend on accurate sustainability profiles to make informed choices about biomaterials used in pharmaceutical applications, ensuring that environmental promises are backed by auditable evidence.
Conclusion
The life cycle assessment of biopolymer production reveals a complex landscape where environmental benefits are not inherent but are contingent on specific feedstock choices, process efficiencies, energy sources, and end-of-life management. For biomedical researchers, a rigorous, standardized LCA is an indispensable tool for moving beyond vague 'green' marketing to make scientifically sound, sustainable material selections. Key takeaways include the paramount importance of the functional unit, the high sensitivity of results to energy mix and agricultural inputs, and the significant trade-offs between impact categories like carbon footprint and eutrophication. Future directions must focus on developing high-quality, region-specific inventory data for emerging biopolymers like PHAs, integrating LCA early in the R&D phase of biomedical devices, and exploring novel routes like carbon capture feedstocks. Ultimately, robust LCA practice will drive innovation towards truly sustainable biomaterials that minimize environmental burden without compromising clinical performance, aligning material science with planetary health goals.