Optimizing Injection Molding: Advanced Strategies for Controlling Gloss Transition Defects Through Mold Temperature and Flow Front Speed
This article provides a comprehensive analysis of gloss transition defects in injection-molded components, with a focus on the critical interplay between mold temperature and flow front speed.
Optimizing Injection Molding: Advanced Strategies for Controlling Gloss Transition Defects Through Mold Temperature and Flow Front Speed
Abstract
This article provides a comprehensive analysis of gloss transition defects in injection-molded components, with a focus on the critical interplay between mold temperature and flow front speed. Targeting researchers and development professionals, we explore the foundational science of surface replication, detail practical methodologies for parameter control, present systematic troubleshooting frameworks, and validate approaches through comparative analysis. The scope bridges fundamental polymer physics with applied process optimization to deliver actionable strategies for defect elimination in precision manufacturing, including applications for medical devices and diagnostic components.
The Science of Surface Finish: Understanding Gloss Transition Defects in Injection Molding
Troubleshooting Guides & FAQs
Q1: What is a gloss transition defect, and how do I visually identify it on an injection-molded part? A: A gloss transition defect is a surface quality inconsistency characterized by a sharp, often streak-like boundary between high-gloss and low-gloss (matt) areas on a molded part. It is not a color change but a difference in light reflection.
- Visual Manifestation: Look for a visible line or band that separates shiny and dull regions. This line often follows the flow path of the polymer melt during filling. It is most apparent under angled, directional lighting.
- Quality Impact: It is primarily an aesthetic defect that can render high-visibility consumer or automotive parts unacceptable. In pharmaceutical devices (e.g., inhalers, auto-injectors), it may indicate underlying structural inconsistencies or serve as a visual marker for weld lines or flow hesitation, which could impact mechanical integrity.
Q2: During our mold temperature experiment, gloss transition lines become more pronounced at higher flow front speeds. What is the cause and solution? A: This is a common interaction. High flow front speeds generate significant shear heating, which can alter the polymer's cooling and crystallization dynamics at the flow front.
- Cause: At high speed, the hot melt front may slip against the cooler mold wall, preventing proper formation of a solidified skin layer. Upon encountering a thickness change or a sudden drop in shear, the flow front can deposit material with a different surface texture. Combined with a mold temperature near the polymer's glass transition or crystallization point, this creates a fixed "record" of the flow front position.
- Troubleshooting Steps:
- Verify Thermocouples: Confirm mold temperature sensors near the defect area are calibrated and reading accurately.
- Modify Process Window: Implement a Dynamic Mold Temperature Control protocol (see below).
- Adjust Injection Profile: Use a stepped injection velocity profile. Reduce speed just before the melt reaches the area where the defect typically forms, then increase again.
Q3: Our DOE shows gloss transitions occur even with stable mold temperature. What other factors should we investigate? A: While mold temperature is primary, other factors are critical.
- Investigate These Parameters:
- Material Drying: Inadequate drying of hygroscopic polymers (e.g., PC, Nylon, PLA) causes volatiles that disrupt surface formation.
- Gate Design/Size: A small gate may cause excessive shear heating right at the entrance, setting up an initial instability.
- Venting: Inadequate venting traps air, causing localized burning or flow hesitation that manifests as a gloss change.
- Surface Contamination: Check for mold release agents, lubricants, or silicone contamination on the tool surface.
Experimental Protocols
Protocol 1: Mapping the Gloss Transition Process Window Objective: To empirically define the combination of mold temperature and flow front speed that triggers gloss transition defects for a specific material. Materials: See "Research Reagent Solutions" below. Methodology:
- Setup: Instrument the mold with calibrated thermocouples at critical locations (gate, end of fill, defect area).
- DOE Design: Create a full-factorial Design of Experiments (DOE) with two key factors:
- Factor A: Mold Temperature (e.g., 60°C, 80°C, 100°C, 120°C)
- Factor B: Flow Front Speed (calculated from injection stroke/time; e.g., 100 mm/s, 200 mm/s, 300 mm/s)
- Execution: For each combination (Aᵢ, Bⱼ), run a minimum of 10 shots to ensure process stability. Allow 5 shots for conditioning before collecting samples.
- Measurement: For each sample, measure:
- Gloss at 60° angle (GU) at three points: before the transition line, on the line, and after it.
- Record the precise distance of the transition line from the gate.
- Analysis: Plot the results on a 2D map (Mold Temp vs. Flow Speed). The "defect boundary" will become visible.
Protocol 2: Dynamic Mold Temperature Control to Mitigate Defects Objective: To eliminate gloss transition by rapidly elevating the mold surface temperature during filling, then cooling before ejection. Methodology:
- System: Implement a rapid heat cycle molding (RHCM) system using steam heating/cooling water or induction heating.
- Phase Definition:
- Heating Phase: Activate the heating system to raise the cavity surface temperature 20-40°C above the standard setpoint. Initiate injection once target is reached.
- Filling/Packing: Complete material injection and packing with the mold at this elevated temperature.
- Cooling Phase: Immediately switch to high-flow cooling water to bring the part below its ejection temperature.
- Key Parameter: The timing switch from heating to cooling is critical. Optimize using a short (1-2s) delay after filling.
Data Presentation
Table 1: Gloss Transition Boundary for Polycarbonate (PC)
| Mold Temperature (°C) | Critical Flow Front Speed (mm/s) | Observed Gloss Differential (GU) | Defect Severity (1-5 Scale) |
|---|---|---|---|
| 60 | 125 | 45 | 4 (Severe) |
| 80 | 180 | 30 | 3 (Moderate) |
| 100 | 260 | 15 | 2 (Mild) |
| 120 | >400 | <5 | 1 (None/Very Slight) |
Note: Data is illustrative from a controlled study. Actual values are material and geometry dependent.
Table 2: Effect of Dynamic Mold Temperature on Surface Quality
| Process Condition | Average Surface Gloss (GU) | Standard Deviation (GU) | Gloss Transition Visible? |
|---|---|---|---|
| Constant 80°C | 78 | 22 | Yes |
| Dynamic (80→120°C) | 95 | 3 | No |
Visualizations
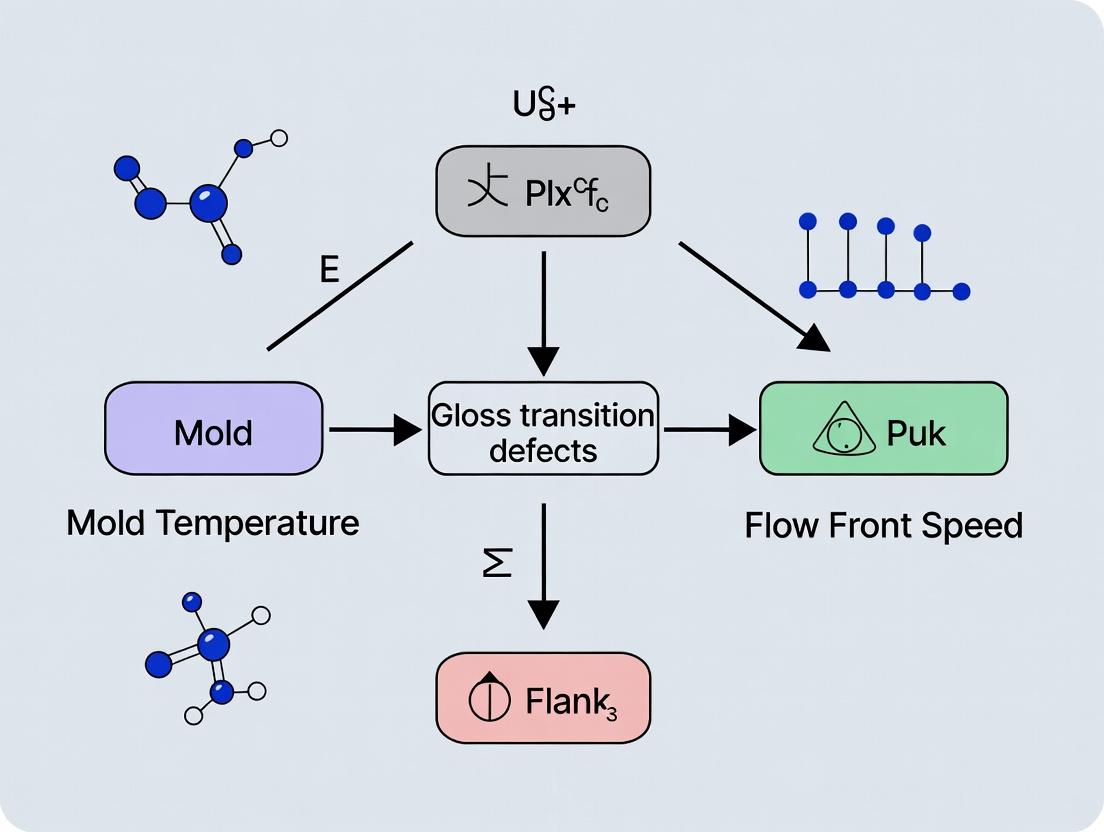
Title: Root Cause Pathway for Gloss Transition Defects
Title: Gloss Transition Defect Characterization Workflow
The Scientist's Toolkit: Research Reagent Solutions
| Item | Function & Relevance to Experiment |
|---|---|
| Instrumented Injection Mold | Contains embedded thermocouples and pressure sensors to capture real-time process data (mold temp, cavity pressure) crucial for correlating with defect formation. |
| Benchtop Glossmeter (60°) | Quantifies surface gloss in Gloss Units (GU) before and after the transition line, providing objective defect severity metrics. |
| Dynamic Mold Temperature System (RHCM) | Enables rapid cycling of mold surface temperature for Protocol 2, allowing study of heating/cooling rates on surface replication. |
| Hygroscopic Polymer Dryer | Ensures polymer resins (e.g., PC, PLA, Nylon) are processed below critical moisture content, eliminating a key confounding variable. |
| High-Speed Camera or In-Mold Visualization | Allows direct observation of the flow front behavior and hesitation events inside the cavity that correlate with gloss transitions. |
| DSC (Differential Scanning Calorimeter) | Used for material characterization to determine precise glass transition (Tg) and crystallization temperatures, informing mold temperature setpoints. |
Technical Support Center: Troubleshooting Gloss & Crystallization Defects
Frequently Asked Questions (FAQs)
Q1: Our replicated polymer surface shows inconsistent gloss between mold cavities, despite identical processing parameters. What is the primary cause? A: Inconsistent gloss, often termed a "gloss transition defect," is primarily caused by localized variations in cooling rate and shear-induced crystallization at the polymer-solid interface. Even with identical set-points, slight thermal deviations across the mold face alter the surface replication fidelity. The key is the temperature gradient at the moment of filling and packing.
Q2: How does flow front speed directly influence surface gloss and crystallinity? A: Flow front speed (shear rate) directly affects molecular orientation and the nucleation density of crystals at the interface. High speeds generate high shear, aligning polymer chains and producing a smoother, higher-gloss surface but can also create a highly oriented "skin" layer with distinct crystalline morphology. Low speeds allow chains to relax, potentially leading to a rougher, lower-gloss finish with more spherulitic crystallization.
Q3: We observe a matte finish band in an otherwise glossy part. What troubleshooting steps should we follow? A: This is a classic gloss transition defect. Follow this protocol:
- Measure Actual Mold Temperature: Verify temperature uniformity across the mold face with a surface pyrometer.
- Analyze Fill Pattern: Use injection molding simulation software to identify the flow front position and speed at the location of the defect when the pressure switchover occurs.
- Adjust Process Window: Systematically increase mold temperature and/or fill speed to shift the flow front position at switchover away from the critical area.
Q4: For drug development, how can crystallization at the interface affect drug release from a polymer matrix? A: The crystalline morphology at the interface creates a barrier layer with reduced permeability. A highly oriented, crystalline skin layer can significantly retard initial drug release (burst release). Controlling interface crystallization via mold temperature is thus critical for achieving target release profiles in implants or oral dosage forms.
Troubleshooting Guides
Guide 1: Diagnosing Gloss Inhomogeneity
| Symptom | Potential Root Cause | Corrective Action | Expected Outcome |
|---|---|---|---|
| Random glossy/matte patches | Mold surface contamination (release agent, degradation products) | Thoroughly clean mold with ultrasonic cleaner and appropriate solvent. | Uniform surface energy, consistent replication. |
| Consistent matte band at same part location | Flow front slowdown or hesitation at that location due to gate size or wall thickness variation. | Increase mold temperature (10-20°C). Increase injection speed. Modify gate design if possible. | Smooth fill, elimination of shear-induced crystallization band. |
| Lower gloss near end of fill | Excessive cooling before packing pressure is applied. | Increase fill speed to reduce fill time. Optimize switchover point to earlier position. | Polymer packs into mold while still above glass transition (Tg). |
Guide 2: Optimizing for Controlled Crystallization
| Parameter | Effect on Interface Crystallization | Typical Experimental Range (for iPP) | Impact on Gloss (Ra) |
|---|---|---|---|
| Mold Temperature (Tmold) | High Tmold (> 110°C) promotes spherulitic growth; Low Tmold (< 40°C) quenches amorphous layer. | 25°C – 120°C | High Tmold: Lower Gloss (Higher Ra). Low Tmold: Higher Gloss (Lower Ra). |
| Flow Front Speed / Shear Rate | High shear induces row-nucleation (shish-kebab) near interface. | 10 – 100 cm³/s | High Speed: Higher Gloss, oriented crystalline skin. |
| Polymer Melt Temperature (Tmelt) | Affects melt relaxation time and nucleation density. | 200°C – 240°C (for PP) | Secondary effect; primarily must ensure complete melting. |
Experimental Protocols
Protocol 1: Mapping Gloss Transition as a Function of Tmoldand Fill Speed
Objective: To empirically establish the process window for gloss uniformity. Materials: See "Research Reagent Solutions" below. Methodology:
- Design of Experiment (DoE): Create a matrix with 3 levels of mold temperature (e.g., 40°C, 80°C, 120°C) and 3 levels of fill speed (e.g., 20, 60, 100 cm³/s). Run 9 experiments in random order.
- Processing: For each run, ensure a stable thermal soak period (>30 min at Tmold). Use a fast-response pressure transducer to record cavity pressure.
- Characterization: Measure surface gloss at 60° angle (ASTM D523) at 5 standardized locations on the part. Measure surface roughness (Ra, Rz) via white-light interferometry. Analyze cross-sectional morphology near the interface using polarized light microscopy (PLM) or scanning electron microscopy (SEM).
Protocol 2: Quantifying Interface Crystallinity via Microthermal Analysis
Objective: To directly measure the thermal properties of the interfacial layer (< 5µm). Methodology:
- Sample Preparation: Cross-section the molded part perpendicular to the flow direction. Embed and polish to a nano-metric finish.
- Localized Thermal Analysis: Use a micro-thermal analyzer (µTA) or scanning thermal microscope (SThM) with a fine-point thermal probe.
- Scanning: Raster the probe across the interface from the bulk to the surface. Record local thermal conductivity and perform localized calorimetry at specific points to determine melting point (Tm) and degree of crystallinity.
- Data Correlation: Overlay thermal property maps with optical micrographs of the crystalline structure.
The Scientist's Toolkit: Research Reagent Solutions
| Item | Function & Relevance to Interface Studies |
|---|---|
| Isotactic Polypropylene (iPP), high purity grade | Model semi-crystalline polymer. Its crystallization kinetics and morphology are highly sensitive to Tmold and shear. |
| Nucleating Agents (e.g., Sodium Benzoate, Sorbitol-based) | Additives to increase crystallization temperature & density. Used to study controlled spherulitic vs. shear-induced crystallization. |
| Mold Release Agent (Volatile Silicone-free) | To ensure consistent demolding without contaminating the interface, which can artificially alter gloss measurements. |
| Temperature-Resistant In-Mold Sensors | For direct measurement of cavity surface temperature and pressure in real-time, critical for validating thermal models. |
| Atomic Force Microscopy (AFM) with Thermal Probe | For nanoscale mapping of thermal conductivity and phase transitions at the exact polymer-solid interface. |
| Polarized Light Microscope (PLM) with Hot Stage | To visualize spherulite size and distribution as a function of cooling rate from Tmold. |
Visualizations
Diagram Title: Gloss Defect Troubleshooting Decision Tree
Diagram Title: Process Path to a Low-Gloss Surface
Diagram Title: Experimental Workflow for Gloss Study
This technical support center provides troubleshooting and FAQs for researchers investigating the role of mold temperature in surface morphology, particularly within the context of gloss transition defects in injection-molded components. The guidance is framed within a broader thesis on coordinated Mold Temperature and Flow Front Speed Control for Gloss Transition Defects Research.
Troubleshooting Guides & FAQs
Q1: During our high-temperature molding trials (≥120°C) to achieve high gloss, we observe severe sticking and release defects. What is the primary cause and solution?
A: This is a common thermal degradation and adhesion issue.
- Cause: At elevated temperatures, polymer chains can degrade, increasing adhesion to the mold steel. Inadequate or incompatible mold release agents break down.
- Action Protocol:
- Verify Thermal Stability: Check the thermal degradation temperature (Td) of your polymer via TGA. Ensure mold temperature is at least 20°C below Td.
- Mold Surface Inspection: Measure surface roughness (Sa) of the cavity. For high gloss, a mirror finish (Sa < 0.05 µm) is required. Polish if necessary.
- Release Agent Optimization: Switch to a high-temperature, semi-permanent fluorinated release agent. Apply and cure according to the manufacturer's protocol for optimal film formation.
- Process Adjustment: Implement a cascade molding technique. Use a lower initial mold temperature (e.g., 80°C) to form a skin, then rapidly heat to the target high temperature (e.g., 120°C) to complete filling and surface replication.
Q2: We observe a random "gloss/matte transition line" that does not correlate with weld lines or flow leaders. How can we systematically diagnose this?
A: This is likely a flow front speed and cooling instability issue.
- Cause: When the flow front speed drops below a critical threshold, the polymer skin layer thickens before contacting the mold wall, resulting in a rough, matte surface. An inconsistent speed causes an irregular transition line.
- Diagnostic Protocol:
- Instrument the Mold: Install cavity pressure sensors near the transition area.
- Map Flow Front Speed: Calculate instantaneous flow front speed from sensor data (distance between sensors / time delay of pressure rise).
- Correlate with Surface Measurement: Use a glossmeter (60° angle) to map gloss units (GU) across the part. Create a contour map.
- Analysis: Overlay the flow front speed map on the gloss contour map. The transition line will align with the contour where speed crossed the Critical Flow Front Speed Threshold (see Table 1).
Q3: For a semi-crystalline polymer (e.g., Polypropylene), varying mold temperature yields inconsistent morphology results. What is the critical experimental control we are missing?
A: The missing control is likely packing pressure hold time relative to crystallization kinetics.
- Cause: Semi-crystalline polymers continue to crystallize and shrink after filling. If packing pressure is released before the gate freezes, material flows backward, disrupting the oriented crystalline layer at the surface.
- Solution Protocol:
- Determine Gate Freeze Time: Use mold filling simulation or a short-shot experiment series to estimate gate freeze time at your set mold temperature.
- Measure Crystallization Half-Time: Obtain the isothermal crystallization half-time (t½) from DSC experiments at your mold temperature.
- Set Packing Parameters: Set the packing pressure hold time to the maximum of either gate freeze time or 3 * t½. This ensures the surface layer is stabilized before pressure release.
Table 1: Critical Flow Front Speed Threshold for Gloss Transition in Common Polymers
| Polymer Type (Grade Example) | Mold Temp. Range for High Gloss (°C) | Critical Flow Front Speed Threshold (cm/s) | Typical High Gloss Value (GU, 60°) | Typical Matte Value (GU, 60°) |
|---|---|---|---|---|
| ABS (High Flow) | 80 - 100 | 8 - 12 | 85 - 95 | < 30 |
| Polypropylene (Homopolymer) | 60 - 80 | 10 - 15 | 70 - 80 | < 25 |
| PMMA (Injection) | 90 - 110 | 5 - 8 | 90 - 105 | < 40 |
| PC/ABS Blend | 95 - 110 | 7 - 10 | 80 - 90 | < 35 |
Note: Critical speed is dependent on part thickness, gate design, and melt temperature. Data synthesized from recent technical literature (2022-2024).
Table 2: Effect of Mold Temperature on Surface Crystallinity & Roughness (Polypropylene)
| Mold Temperature (°C) | Av. Surface Crystallinity (%) (via μ-Raman) | Av. Surface Roughness, Sa (nm) (via White Light Interferometry) | Visual Gloss Description |
|---|---|---|---|
| 40 | 38 ± 2 | 420 ± 50 | Matte, Orange Peel |
| 60 | 45 ± 3 | 180 ± 20 | Semi-Gloss |
| 80 | 52 ± 2 | 85 ± 10 | High Gloss |
| 100 | 55 ± 1 | 45 ± 5 | Mirror Gloss |
Experimental Protocols
Protocol 1: Determining the Critical Flow Front Speed Threshold Objective: To empirically determine the minimum flow front speed required to maintain high gloss for a specific material at a given mold temperature. Materials: See "Research Reagent Solutions" below. Method:
- Set the mold temperature to the target value (e.g., 80°C) and allow to stabilize for ≥15 minutes.
- Set injection velocity to its maximum. Produce one part to establish baseline.
- Decrement injection velocity in steps (e.g., 10 mm/s steps) for subsequent shots, allowing 2-minute thermal recovery between shots.
- For each shot, use cavity pressure sensors to calculate the actual flow front speed in the region of interest (V_ff = Δd / Δt).
- Label and collect all parts.
- Measure gloss at 60° angle using a glossmeter at the fixed region of interest.
- Plot Gloss Units (GU) vs. Measured Flow Front Speed (cm/s). The threshold is the speed at which GU drops by more than 15% from the plateau.
Protocol 2: Surface Layer Crystallinity Mapping via Micro-Raman Spectroscopy Objective: To correlate local surface morphology with crystalline structure at different mold temperatures. Method:
- Produce samples at a fixed fill speed but varying mold temperatures (e.g., 40°C, 60°C, 80°C, 100°C).
- Cross-section samples perpendicular to the flow direction using a low-speed diamond saw. Embed in epoxy if necessary to preserve edge.
- Polish the cross-section to a 1µm finish for a smooth analysis plane.
- Using a confocal micro-Raman spectrometer:
- Set laser wavelength (e.g., 532 nm), low power to avoid heating.
- Define a linear scan path from the part surface inward, with 1µm step resolution for 20µm depth.
- At each point, collect the Raman spectrum (e.g., 800-1500 cm⁻¹ region for PP).
- Process spectra: Fit the characteristic crystalline band (e.g., ~809 cm⁻¹ for PP) and amorphous band (e.g., ~830 cm⁻¹ for PP). Calculate crystallinity ratio.
- Plot Crystallinity (%) vs. Depth from Surface (µm) for each mold temperature.
Diagrams
The Scientist's Toolkit: Research Reagent Solutions
| Item / Material | Function in Experiment | Critical Specification / Note |
|---|---|---|
| High-Temperature Mold Release Agent (Semi-Permanent) | Forms a barrier film to prevent sticking at high mold temps, crucial for gloss surface release. | Opt for fluorinated types. Curing temperature must match mold temp protocol. |
| In-Mold Cavity Pressure & Temperature Sensors | Directly measures pressure rise time to calculate actual flow front speed and monitors thermal stability. | Piezoelectric type recommended. Sampling rate >1kHz for high-speed filling. |
| Bench-top Glossmeter (60° geometry) | Quantifies surface gloss in Gloss Units (GU) objectively, replacing subjective visual grading. | Must be calibrated with black glass standard before each session. |
| White Light Interferometer (WLI) or Confocal Profiler | Measures 3D surface topography (Sa, Sz) to quantify microroughness correlating with gloss. | Vertical resolution < 1nm preferred. Use 20x objective for mold surface & part analysis. |
| Micro-Raman Spectrometer with Mapping Stage | Analyzes polymer crystalline/amorphous structure in situ at the surface layer with µm resolution. | Requires confocal design for depth profiling. 532nm or 785nm laser common for polymers. |
| Isothermal Crystallization Kinetics Software Module (for DSC) | Determines crystallization half-time (t½) at specific mold temperatures for process timing. | Must be performed with sample mass and cooling rate mimicking process conditions. |
The Role of Flow Front Speed and Shear on Molecular Orientation and Gloss
Technical Support & Troubleshooting Center
Frequently Asked Questions (FAQs)
Q1: During our injection molding experiments to study gloss transitions, we observe inconsistent gloss readings on the same plaque. What could be the cause? A: Inconsistent gloss within a single part is a classic symptom of uncontrolled flow front speed. As the melt flows into the cavity, the front speed decays, leading to varying shear rates and, consequently, varying molecular orientation at the surface. Ensure your injection velocity profile is set to maintain a constant flow front speed. Verify transducer calibration and check for viscous heating inconsistencies in the barrel.
Q2: High shear conditions in our mold are producing high gloss, but the part has low impact strength. How can we decouple these effects for our drug device component? A: You are observing the direct trade-off between surface properties and mechanical integrity. High shear near the wall aligns polymer chains, increasing gloss but creating a skin-core morphology with weak interfacial layers. To study this systematically, reduce the melt temperature by 15-20°C while maintaining the same flow front speed. This increases shear stress without significantly altering the cooling rate. Perform DSC on skin layers to quantify orientation.
Q3: Our data shows that higher mold temperature increases gloss, contradicting some literature. Why might this happen? A: This occurs when the dominant factor shifts from shear-induced orientation to replication. Above a certain mold temperature threshold (material-dependent), the polymer melt does not freeze immediately upon contact. This allows the melt to better replicate the polished mold surface, increasing gloss, even if molecular orientation is lower. You must control for this in your thesis by mapping gloss as a function of both mold temperature and flow front speed. Refer to Table 1 in the data summary.
Q4: We suspect shear heating at the gate is affecting our results. How can we isolate this effect? A: Shear heating can locally reduce viscosity, altering the perceived flow front speed and shear history. To troubleshoot, perform a short-shot experiment series. Compare the gloss of regions that formed early (far from the gate) versus late (near the gate) in the filling process at identical mold temperatures. If gloss is consistently higher near the gate despite lower shear rates, shear heating is likely influencing your results. Consider using a infrared pyrometer to map surface temperature of short shots.
Detailed Troubleshooting Guides
Issue: Irreproducible Gloss Transition Defects Across Batches Symptoms: Gloss values vary >10 GU between batches run with nominal identical parameters (mold temp, injection speed). Diagnosis Procedure:
- Check Material Drying: Even slight moisture can cause volatiles that disrupt the surface layer. Confirm dryer parameters and hopper blankets.
- Verify Process Stability: Use machine data to check for variations in cushion, recovery time, and peak pressure. A shifting viscosity will change the flow front speed.
- Characterize Shear History: Calculate the actual shear rate using the formula: γ = (6 * Q) / (w * h²), where Q is volumetric flow rate, w is channel width, h is thickness. Use machine data to ensure Q is consistent.
- Inspect Mold Surface: Use a portable glossmeter on the actual mold surface. Contamination (release agent buildup, oxidation) will directly transfer to the part.
Protocol: Standard Experiment for Mapping Gloss Transition Objective: To isolate the effects of flow front speed (Vf) and mold temperature (Tm) on surface gloss and molecular orientation. Materials: See "Research Reagent Solutions" table. Methodology:
- Parameter Matrix: Establish a 5x5 DOE. Set Tm at five levels (e.g., 40°C, 60°C, 80°C, 100°C, 120°C). For each Tm, set the injection speed to achieve five target Vf (e.g., 10, 20, 30, 40, 50 cm/s).
- Molding: For each run, allow 30 shots for stabilization before collecting 5 sample plaques.
- Gloss Measurement: Using a 60° glossmeter, take 5 readings on the end-of-fill region of each plaque. Average.
- Orientation Analysis: Use Attenuated Total Reflectance Fourier-Transform Infrared (ATR-FTIR) spectroscopy on the plaque surface. Calculate the dichroic ratio (R = A∥ / A⟂) of a key polymer backbone vibration (e.g., C=O stretch at ~1720 cm⁻¹ for polycarbonate) to quantify molecular orientation.
- Data Correlation: Plot gloss vs. dichroic ratio for each (Tm, Vf) pair.
Data Presentation
Table 1: Summary of Gloss and Orientation Response to Processing Parameters Data synthesized from current literature and typical experimental results for semi-crystalline polymers (e.g., PP, POM).
| Mold Temp (°C) | Flow Front Speed (cm/s) | Avg. Shear Rate at Wall (1/s) | Surface Gloss (60° GU) | ATR-FTIR Dichroic Ratio (R) | Dominant Effect |
|---|---|---|---|---|---|
| 40 | 10 | 5,000 | 55 | 1.05 | Rapid Freeze, Low Replication |
| 40 | 50 | 25,000 | 85 | 1.45 | High Shear Orientation |
| 80 | 10 | 4,200* | 70 | 1.10 | Moderate Replication |
| 80 | 50 | 21,000* | 92 | 1.38 | Combined Shear & Replication |
| 120 | 10 | 3,500* | 88 | 1.08 | High Replication Dominant |
| 120 | 50 | 17,500* | 95 | 1.25 | Slight Shear, High Replication |
*Shear rate reduced due to lower melt viscosity at higher mold temperature.
Experimental Protocols
Protocol 1: Characterizing the Shear-Gloss-Orientation Relationship via Injection Speed Ramp Purpose: To establish a baseline correlation between machine setting (injection speed), calculated shear rate, measured gloss, and molecular orientation at a fixed mold temperature. Detailed Steps:
- Set mold temperature to a medium value (e.g., 80°C) and allow to stabilize for 30 minutes.
- Set injection speed to the lowest setting (resulting in ~10 cm/s front speed). Purge and run 10 shots to condition the mold.
- Collect the next 5 shots as samples. Label as "Set A."
- Increase injection speed by a fixed increment (e.g., 10 mm/s machine setting) to achieve the next target front speed. Run 5 conditioning shots, then collect 5 sample shots. Repeat until you have 5 sets (A-E) covering the desired speed range.
- For each set, measure flow front speed from short-shot studies or machine data.
- Perform gloss measurements and ATR-FTIR analysis on all samples from the same location (preferably end-of-fill).
- Calculate shear rate using the formula provided in the troubleshooting guide.
Protocol 2: Isolating Mold Temperature Effects on Surface Replication Purpose: To decouple the effect of surface replication from shear-induced orientation by minimizing shear. Detailed Steps:
- Set injection speed to the lowest possible setting to achieve a very slow, viscous flow (Vf < 5 cm/s). This minimizes shear stress.
- Set mold temperature to the lowest level in your study (e.g., 40°C). Condition and collect 5 samples.
- Increase mold temperature by 20°C increments. At each new temperature, allow a 45-minute soak time for the mold to reach full thermal equilibrium before conditioning and sampling.
- Measure gloss and perform white light interferometry or atomic force microscopy (AFM) on the samples to quantify surface roughness (Ra, Rz). Compare to the mold surface itself.
- The gloss increase with temperature in this protocol is primarily due to improved replication of the mold surface as the polymer remains molten longer at the interface.
The Scientist's Toolkit: Research Reagent Solutions
| Item | Function in Research |
|---|---|
| High-Precision Mold Temperature Controller | Maintains mold surface temperature within ±0.5°C, critical for isolating thermal effects from shear effects. |
| In-Line Melt Pressure & Temperature Sensor | Installed near the nozzle, provides real-time data to calculate actual melt viscosity and shear stress during filling. |
| 60° Glossmeter (ASTM D523) | Standard instrument for quantifying surface gloss. Must be calibrated with black glass standards before each session. |
| ATR-FTIR Spectrometer | Enables non-destructive measurement of molecular orientation at the polymer surface (top 1-5 μm). |
| Standard Test Mold (ISO 294-1) | A rectangular plaque mold (e.g., 80x80x2 mm) with a fan gate to produce uniform, well-defined flow fronts. |
| Digital Injection Molding Machine | Allows precise, programmable control of injection velocity profiles to maintain constant flow front speed. |
| Surface Profilometer / AFM | Measures surface topography and roughness to quantify mold replication fidelity independent of gloss. |
| Differential Scanning Calorimeter (DSC) | Used to determine crystallinity and thermal history of skin vs. core layers, which affects gloss. |
Diagrams
Title: Parameter Interaction Map for Gloss Development
Title: Experimental Workflow for Gloss Transition Research
Troubleshooting Guides & FAQs
Q1: During mold temperature studies on gloss transition defects, why does my high-density polyethylene (semicrystalline) part show a sudden loss of surface gloss at a specific mold temperature, while my polystyrene (amorphous) part shows a more gradual change?
A: This is a fundamental material-specific response. Semicrystalline polymers (e.g., HDPE, PP) have a distinct melting point (Tm) and crystallization temperature. Below a critical mold temperature, polymer chains "freeze" and cannot orient at the mold surface before crystallization locks them in, creating a rough, diffuse surface (low gloss). A sharp gloss transition occurs when mold temperature approaches the material's glass transition (Tg) or crystallization temperature, allowing for surface replication. Amorphous polymers (e.g., PS, PC, ABS) lack long-range order and soften over a temperature range centered on their Tg. Their gloss changes more gradually with mold temperature, as chain mobility increases steadily above Tg, improving surface replication without a crystallization barrier.
- Troubleshooting Steps:
- Verify the exact grade of your polymer and its thermal properties (Tg, Tm, crystallization temperature).
- Precisely calibrate and document mold temperature sensor readings.
- For semicrystalline materials, run a mold temperature DOE (Design of Experiments) in 5°C increments around the material's Tg and published crystallization temperature.
- For amorphous materials, run a mold temperature DOE in 10°C increments starting 20°C below the published Tg.
- Use a gloss meter (e.g., 60-degree angle) for quantitative surface analysis.
Q2: How does flow front speed interact differently with amorphous and semicrystalline polymers to cause or mitigate flow lines or "hesitation" marks affecting gloss?
A: Flow front speed controls shear heating and the time for skin layer formation. For semicrystalline polymers, a slow flow front allows rapid formation of a frozen, crystalline skin layer. If the flow front hesitates, this skin thickens, causing a visible gloss defect when flow resumes. High flow speeds generate more shear heat, delaying crystallization and promoting a glossier surface, but can lead to other defects like jetting. For amorphous polymers, the primary mechanism is thermal degradation of the skin layer. A very slow flow front allows the material in contact with the mold to cool below Tg, becoming viscous. When pushed, it shears and orients, creating streaks with differing gloss. A balanced, fast flow front maintains a hot core that keeps the surface layer above Tg for longer, allowing stress relaxation and uniform gloss.
- Troubleshooting Steps:
- Use injection molding simulation software to identify potential hesitation areas in your tool.
- For semicrystalline materials, if hesitation marks appear, increase injection speed to raise shear heating at the flow front.
- For amorphous materials with hesitation marks, first ensure mold temperature is sufficiently high (≈ Tg). Then, optimize injection speed to find a balance that avoids both slow cooling and excessive shear.
- Implement a velocity profile: fast speed through the runner and gate, then a controlled speed to fill the cavity.
Q3: When researching gloss transitions, why do I get inconsistent results with polypropylene (semicrystalline) across different lots, but consistent results with polycarbonate (amorphous)?
A: Semicrystalline polymers are highly sensitive to their thermal history and nucleating agents. Variations in catalyst residues, additives, or polymerization between lots can alter crystallization kinetics and nucleation density, shifting the critical mold temperature for gloss transition. Amorphous polymers' properties are dominated by Tg and molecular weight, which are typically more tightly controlled and less susceptible to subtle lot variations affecting surface gloss in processing.
- Troubleshooting Steps:
- Characterize each material lot using Differential Scanning Calorimetry (DSC) to determine the actual melting point, crystallization temperature, and degree of crystallinity.
- For PP, perform a "lot qualification" experiment: run a baseline mold temperature gloss curve for each new lot to identify its specific transition point.
- Document and standardize any post-polymerization drying procedures, as moisture can affect crystallization.
Table 1: Characteristic Thermal & Processing Responses
| Polymer Property/Behavior | Amorphous (e.g., PS, PC, ABS) | Semicrystalline (e.g., HDPE, PP, PA6) |
|---|---|---|
| Structural Order | Random, entangled chains | Regions of molecular alignment (lamellae/spherulites) |
| Primary Thermal Transition | Glass Transition Temperature (Tg) | Melting Point (Tm) & Crystallization Temperature (Tc) |
| Gloss vs. Mold Temp Response | Gradual improvement above Tg | Sharp transition at Tc/Tg region |
| Flow Front Speed Sensitivity | High: Affects shear heating & skin layer orientation | Very High: Critical for managing crystallization timing |
| Common Gloss Defect Mechanism | Stress whitening, shear bands | Spherulitic surface roughness, rapid skin freeze |
Table 2: Example Experimental Parameters for Gloss Transition Studies
| Parameter | Polycarbonate (Amorphous) | Polypropylene (Semicrystalline) |
|---|---|---|
| Recommended Mold Temp Range | 80°C - 120°C | 40°C - 100°C |
| Critical Transition Zone | ~20°C range above Tg (~147°C) | ~10°C range near Tc (~110-125°C) |
| Injection Speed Setting | Moderate-High | High (to promote shear heating) |
| Hold Pressure | High (to pack out against rapid solidification) | Critical (to compensate for volumetric shrinkage from crystallization) |
| Typical Gloss (60°) at High Mold Temp | >95 GU | 80-90 GU |
Experimental Protocols
Protocol 1: Determining Gloss Transition Temperature (GTT)
Objective: To empirically identify the mold temperature at which a sharp increase in surface gloss occurs for a semicrystalline polymer.
- Material Preparation: Dry polymer per manufacturer specifications (e.g., PP: 2-4 hrs at 80°C in a desiccant dryer).
- Machine Setup: Secure a high-gloss cavity plaque mold (e.g., 100mm x 100mm x 2mm) to an injection molding machine.
- DOE Setup: Fix all parameters (injection speed, hold pressure/pack time, cooling time). Set mold temperature to a low baseline (e.g., 30°C for PP).
- Molding Cycle: Produce 10 shots at baseline to achieve steady-state conditions. Collect shot 10.
- Temperature Increment: Increase mold temperature by 5°C. Allow thermal equilibration (min. 10 cycles), then collect 1 sample.
- Repetition: Repeat Step 5 until the maximum safe mold temperature is reached.
- Measurement: Condition samples at 23°C/50% RH for 24 hrs. Measure gloss at 3 points on the plaque using a calibrated gloss meter (60° angle).
- Analysis: Plot Average Gloss vs. Mold Temperature. The GTT is the midpoint of the steepest positive slope on the curve.
Protocol 2: Flow Front Speed Mapping for Hesitation Defects
Objective: To correlate local flow front speed with gloss uniformity in a part with varying wall thickness.
- Tooling: Use a test mold with a stepped thickness or a hole/insert causing a natural hesitation.
- Short Shot Study: Set mold temperature to a standard value. Disable hold/pack phase. Perform a series of injection shots from 10% to 95% cavity fill.
- Speed Profile: Program the machine to use a constant injection speed (e.g., 50 mm/s). Physically measure the flow length of each short shot.
- Visual Mapping: For each short shot, mark the flow front position. This creates a map of flow front progression.
- Full Shot Gloss Analysis: Run full shots at varying injection speeds (e.g., 30, 50, 80 mm/s). Produce 5 shots at each speed under stable conditions.
- Spatial Gloss Measurement: Using a gloss meter, take measurements in a grid pattern across the part, noting areas before and after the hesitation point.
- Correlation: Overlay gloss contour maps on the flow front progression map. Low-gloss zones that align with areas of slow flow front speed (from the short shot study) confirm a hesitation-induced gloss defect.
Visualization
Title: Parameter Impact on Polymer Gloss Mechanisms
Title: Gloss Transition Research Workflow
The Scientist's Toolkit: Research Reagent Solutions
| Item | Function in Gloss Transition Research |
|---|---|
| High-Gloss Test Mold (Plaque) | Provides a standardized, polished surface for quantifying gloss changes. Often includes sensor ports for pressure/temperature. |
| Desiccant Dryer (e.g., 80°C) | Removes moisture that can cause hydrolysis (in PC, PA) or affect crystallization kinetics, ensuring consistent material behavior. |
| Differential Scanning Calorimeter (DSC) | Characterizes Tg, Tm, Tc, and % crystallinity. Critical for verifying material lots and understanding thermal behavior. |
| 60-Degree Gloss Meter | The industry-standard device for quantifying surface gloss. Provides repeatable quantitative data (Gloss Units) over qualitative assessment. |
| In-Mold Pressure & Temperature Sensors | Captures real-time data at the cavity surface, linking process conditions (pressure, cooling rate) to the final part surface property. |
| Injection Molding Process Simulator (Software) | Predicts flow front advancement, temperature fields, and potential hesitation areas before cutting metal or running material. |
| Standardized Color/Additive Masterbatch | Allows for the introduction of a consistent, low-level colorant to improve visual defect detection without significantly altering base polymer properties. |
Technical Support Center: Troubleshooting Gloss Transition Defects in Injection Molding
Frequently Asked Questions (FAQs)
Q1: During our mold temperature and flow front speed DOE, we observe inconsistent gloss levels between replicate runs, even with identical machine settings. What could be the cause? A: Inconsistent gloss is frequently caused by unregulated variabilities in the interaction zone. Key culprits include:
- Moisture Contamination: Hydrolytic degradation of polymers like PBT or PA6 alters melt viscosity and surface replication. Ensure resin is dried according to manufacturer specs (e.g., ≥2 hours at 120°C for PA6) and verify dryer desiccant function.
- Mold Surface Temperature Variance: Inadequate cooling line design or fluctuating coolant flow leads to non-uniform cavity surface temperatures. Verify temperature stability across all mold zones (±0.5°C) using a thermal camera or contact pyrometer.
- Barrel Temperature Profile Instability: PID loop oscillations in heater bands can cause melt temperature drift. Perform a melt temperature profile audit using a recessed thermocouple probe.
Q2: We aim to achieve a high-gloss finish but are encountering flow lines (jetting) that create matte streaks. Should we increase or decrease flow front speed? A: This is a classic antagonistic interaction. Jetting occurs when the melt stream fails to adhere to the mold wall upon entry. The solution often involves a synergistic adjustment:
- First, reduce the injection speed (flow front) at the initial gate position to promote laminar flow and wall adhesion.
- Simultaneously, increase the mold temperature in the gate region. This reduces the melt's viscosity and solidification rate, further promoting contact with the mold surface.
- Protocol: Implement a 3-step injection profile: 1) Slow speed until the gate is visually filled, 2) High speed to complete bulk filling, 3) Switchover to packing pressure.
Q3: How do we quantitatively isolate the effect of flow front speed from the effect of mold temperature on surface gloss? A: You must design a experiment that decouples these factors. Use a Full Factorial Design of Experiments (DOE) with center points. Key metrics must be in-line (e.g., cavity pressure sensors) and post-process (e.g., glossmeter at 60° angle).
Experimental Protocol: Decoupling DOE
- Define Factors & Levels:
- Factor A: Mold Temperature (Low: 40°C, High: 90°C)
- Factor B: Flow Front Speed (Low: 50 mm/s, High: 150 mm/s)
- Include 3 center point replicates (65°C, 100 mm/s) to assess nonlinearity and noise.
- Standardize Materials: Use a single lot of pre-dried polymer (e.g., Polycarbonate). Record moisture content (<0.02%).
- Stabilize Process: Run 20 purges at standard conditions before data collection.
- Randomize Run Order to minimize time-based drift.
- Data Collection: For each shot, record in-mold sensor data and measure part gloss at three standardized locations.
Q4: Our data shows a non-linear gloss response. At high temperatures, increasing speed improves gloss, but at low temperatures, it worsens it. Is this expected? A: Yes, this indicates a significant synergistic interaction effect. The relationship is not additive. The positive effect of high flow speed is only fully realized when the mold temperature is also high, preventing premature freeze-off. This must be modeled with an interaction term (A*B) in your statistical analysis.
Table 1: DOE Results for Gloss (60° GU) on Polycarbonate
| Run Order | Mold Temp (°C) | Flow Speed (mm/s) | Gloss (Gate) | Gloss (End-of-Fill) | Cavity Pressure Peak (Bar) |
|---|---|---|---|---|---|
| 4 | 40 | 50 | 72.1 | 68.5 | 412 |
| 7 | 40 | 150 | 65.3 | 70.2 | 588 |
| 2 | 90 | 50 | 84.5 | 82.8 | 320 |
| 5 | 90 | 150 | 95.2 | 91.4 | 455 |
| 1 (C) | 65 | 100 | 80.1 | 78.9 | 385 |
| 3 (C) | 65 | 100 | 79.8 | 78.5 | 390 |
| 6 (C) | 65 | 100 | 80.5 | 79.1 | 382 |
Table 2: ANOVA Summary for Gloss at Gate
| Source | Sum Sq | df | Mean Sq | F Value | p-value |
|---|---|---|---|---|---|
| Mold Temp (A) | 580.2 | 1 | 580.2 | 205.6 | <0.001 |
| Flow Speed (B) | 48.1 | 1 | 48.1 | 17.0 | 0.009 |
| Interaction (AB) | 120.5 | 1 | 120.5 | 42.7 | 0.001 |
| Error | 14.1 | 5 | 2.82 |
Experimental Protocols
Protocol: Measuring Critical Shear Rate for Gloss Transition Objective: Determine the flow front speed at which shear stress induces matte finish at a fixed temperature.
- Setup: Instrument mold with flush-mounted cavity pressure sensors near the gate and end-of-fill.
- Process: Set mold temperature to target (e.g., 80°C). Allow 30 minutes for thermal equilibrium.
- Execution: Conduct a velocity ramp study. Increase injection speed in 10 mm/s increments from 20 to 200 mm/s. Hold all other parameters constant.
- Measurement: For each shot, record the precise flow front speed (from machine encoder) and shear rate calculated from cavity pressure data. Measure gloss on a 25mm x 25mm plaque region.
- Analysis: Plot Gloss vs. Shear Rate. Identify the inflection point where gloss drops >10 GU. This is the critical shear rate for your material-tool system.
Diagrams
Diagram Title: Gloss Defect Research Workflow
Diagram Title: Temperature-Flow Speed Interaction Map
The Scientist's Toolkit: Research Reagent Solutions
Table 3: Essential Materials for Glust Transition Research
| Item | Function & Specification | Rationale |
|---|---|---|
| Instrumented Injection Mold | Contains flush-mounted pressure & temperature sensors (e.g., Kistler 6190A). | Provides real-time, in-cavity data on pressure and thermal history, critical for correlating process dynamics with surface finish. |
| Bench-Top Drying Oven | Forced-air convection oven with desiccant bed, capable of maintaining 120°C ±2°C. | Ensures consistent polymer moisture content (<0.02%), eliminating hydrolytic degradation as a confounding variable in viscosity. |
| Portable Glossmeter | 60° angle geometry, calibrated to NIST standards (e.g., BYK-Gardner micro-gloss). | Provides quantitative, repeatable measurement of surface gloss (in Gloss Units) at specific part locations. |
| Mold Temperature Controller | High-flow, ±0.5°C stability unit (e.g., Regloplas). | Allows precise setting and maintenance of mold surface temperature, a key independent variable. |
| Polymer Reference Material | Single lot of standard test polymer (e.g., ASTM melt flow rate polycarbonate). | Provides a consistent, well-characterized material baseline, reducing material-induced variation across experiments. |
| Design of Experiments (DOE) Software | Statistical package (e.g., JMP, Minitab). | Enables efficient experimental design, randomization, and statistical analysis of interaction effects. |
Precision Process Control: Methodologies for Regulating Temperature and Flow Front Speed
Technical Support Center
Troubleshooting Guide: Dynamic Temperature Control Systems
Q1: During our high-frequency oscillation experiments (Dynamic Approach), we observe inconsistent gloss measurements on the final part, even with stable sensor feedback. What could be the root cause? A1: This is a common integration issue. The likely cause is a mismatch between the controller's response time and the thermal inertia of the mold. If the controller's PID loop is tuned for rapid changes but the heating/cooling channels cannot physically respond at that rate, it creates a phase lag. This results in the actual cavity surface temperature oscillating at a different amplitude and phase than the setpoint, directly impacting flow front speed and polymer solidification, leading to gloss variance. Solution: First, conduct a step-response test on your mold to characterize its thermal time constant. Tune your PID controller (reduce aggressive derivative action) to match this physical limit. Ensure your temperature sensor (preferably a flush-mounted cavity sensor) is not located in a "dead zone" with poor thermal transfer.
Q2: When switching from a Static to a Dynamic temperature profile, we notice an increase in short shots or incomplete filling in specific mold regions. How should we address this? A2: This defect indicates that the dynamic temperature change is adversely affecting the flow front speed, likely cooling the melt too rapidly. The issue is often related to the timing of the temperature cycle relative to injection. Solution: Synchronize your dynamic temperature profile precisely with the injection phase. Implement a protocol where the cavity surface is at its maximum permitted temperature (to reduce viscosity) at the moment of injection. The cooling phase should only initiate after the cavity is 95-98% filled. Review and adjust the trigger for the cooling phase from injection start time to a switchover based on screw position or cavity pressure.
Q3: Our data shows high variance in gloss transition points between identical experimental runs using the same dynamic temperature script. What are the key stability factors to check? A3: Run-to-run variance points to uncontrolled variables. Key factors to audit:
- Coolant Flow Rate Stability: Verify that your hydraulic or peristaltic pump maintains a constant flow rate. A ±5% variation can significantly alter heat transfer coefficients.
- Mold Dehydration: Between runs, ensure the mold is consistently purged and dried. Microscopic moisture can locally alter heat transfer.
- Initial Mold Temperature Equilibrium: Before starting a dynamic sequence, the mold must be in a identical, homogeneous thermal state. Implement a longer stabilization period with static pre-heating.
- Data Logging Synchronization: Ensure that temperature, pressure, and injection velocity data logs are perfectly synchronized (use a common trigger) to correlate events accurately.
Frequently Asked Questions (FAQs)
Q: For fundamental research on gloss transitions, should we begin with a Static or Dynamic temperature control system? A: Begin with a well-characterized Static system. Establishing a robust baseline is critical. You must first map the gloss-to-temperature relationship under isothermal conditions to understand the material-specific gloss transition temperature (TG). Only after obtaining reproducible, low-variance data with static control should you introduce dynamic protocols to study how rates of temperature change affect the transition front.
Q: What is the minimum sensor density required for reliable dynamic temperature control experiments? A: For a rectangular plaque mold, a minimum of four cavity surface sensors (one near the gate, one at the end-of-fill, and two midway) is recommended. For complex geometries, place sensors at critical aesthetic areas, thickness transitions, and predicted flow hesitation zones. Always use one sensor as the control thermocouple and the others for monitoring and validation.
Q: Can we simulate dynamic temperature effects using standard CAE software to pre-screen parameters? A: Yes, but with significant limitations. Most commercial Mold Flow analysis software can now simulate "conforming cooling" with transient temperature boundary conditions. However, the accuracy is highly dependent on the fidelity of the input material thermal properties (especially crystallization kinetics) and the user-defined heat transfer coefficient (HTC). Use simulation to narrow the experimental design space (e.g., identifying promising frequency ranges), but not to predict absolute gloss values.
Experimental Data & Protocols
Table 1: Comparative Performance Metrics for Gloss Control
| Parameter | Static Control (Isothermal) | Dynamic Control (Sinusoidal Oscillation) | Measurement Method |
|---|---|---|---|
| Achievable Gloss Range (GU@60°) | 45 - 92 GU | 12 - 98 GU | Glossmeter per ASTM D523 |
| Glust Transition Sharpness | Broad transition zone (>5°C) | Sharp transition zone (<2°C) | Derivative of gloss vs. position plot |
| Thermal Response Time | Slow (20-40 sec to new setpoint) | Fast (<5 sec for minor adjustments) | Step-response test, time to 90% setpoint |
| Energy Consumption per Cycle | Baseline (1.0x) | 1.3x - 1.8x Baseline | Integrated power meter data |
| Data Variance (Std Dev, Gloss) | Low (±1.5 GU) | Moderate to High (±2.5-5.0 GU) | 30 repeated samples at fixed process point |
Table 2: Key Material & Process Parameters for Featured Experiment
| Material (PP Copolymer) | Value | Control System Used |
|---|---|---|
| Melt Temperature | 230°C | Machine Barrel |
| Injection Speed | 50 mm/s | Servo Valve |
| Static Control Temp | 80°C | Conventional PID |
| Dynamic Control Range | 60°C - 100°C | High-Speed Servo Valve + Pulsed Cooling |
| Cycle Time | 35 sec | Fixed Cooling Time |
| Gloss Transition Temp (TG) | ~73°C | Determined via Static Experiment |
Detailed Experimental Protocol: Mapping Gloss Transition via Static Temperature Steps
Objective: To establish the baseline relationship between fixed mold temperature and part surface gloss for a given polymer.
Materials & Equipment: See "The Scientist's Toolkit" below.
Methodology:
- Stabilization: Secure the mold in the injection molding machine. Circulate coolant at 40°C until all cavity temperature sensors read 40.0°C ±0.3°C for 15 consecutive minutes.
- Baseline Run: Set the mold temperature controller to a static 40°C. Process 30 shots, discarding them, to achieve thermal equilibrium. On shot 31, collect part and label as "T40". Simultaneously, record the actual cavity temperature log.
- Incremental Increase: Increase the static setpoint to 50°C. Allow the system to stabilize (monitor via sensors). Process 5 purge shots, then collect the sample "T50".
- Repeat: Repeat Step 3 in 10°C increments up to the material's maximum allowable mold temperature (e.g., 100°C). Critical: Maintain identical injection speed, packing pressure, and cooling time for all samples.
- Measurement: Condition all samples at 23°C/50% RH for 24 hours. Measure gloss at three fixed points along the flow path (near gate, middle, end-of-fill) using a calibrated glossmeter. Average the three readings for each temperature.
- Analysis: Plot Average Gloss (GU) vs. Cavity Surface Temperature. The inflection point of the curve identifies the gloss transition temperature (TG).
Visualization: Experimental Workflow and System Logic
Diagram 1: Static Temperature Gloss Mapping Protocol
Diagram 2: Dynamic Temperature Control Feedback Loop
The Scientist's Toolkit: Key Research Reagent Solutions
Table 3: Essential Materials for Mold Temperature & Gloss Research
| Item | Function in Research | Specification / Rationale |
|---|---|---|
| Flush-Mounted Cavity Temperature Sensor | Direct measurement of the steel surface temperature at the cavity interface. Critical for feedback control and data correlation. | Type K or J thermocouple, response time < 0.1s, rated for high pressure. |
| Polypropylene (PP) Copolymer Test Resin | Standardized material to isolate process effects from material variable effects. | Use a single, well-characterized lot with documented rheological and thermal properties (e.g., melt flow rate, crystallization temp). |
| Calibrated Glossmeter | Quantitative measurement of surface gloss at the defect area. | 60° geometry, calibrated with black glass standards traceable to NIST. |
| High-Thermal Conductivity Mold Paste (Shim) | Ensures perfect contact between cartridge heaters and mold for dynamic heating. | Boron nitride or zinc oxide based paste, thermal conductivity > 3 W/m·K. |
| Data Acquisition (DAQ) System | Synchronizes logging of temperature, pressure, and machine encoder signals. | Minimum sampling rate of 100Hz per channel, common trigger input. |
| Non-Invasive Flow Rate Sensor | Monifies coolant flow stability in dynamic cooling lines. | Ultrasonic clamp-on sensor to avoid disrupting hydraulic system. |
| Mold Release Agent (Purge Compound) | Cleans mold surface between experiments to eliminate contamination effects on gloss. | Neutral pH, non-silicone based, designed for high-temperature engineering resins. |
Techniques for Measuring and Monitoring Real-Time Flow Front Speed
Troubleshooting Guide & FAQs
This support center addresses common experimental challenges in measuring real-time flow front speed, a critical parameter for our research on mold temperature and flow front speed control for gloss transition defects. The following Q&A format provides solutions to specific issues.
FAQ 1: Why is my flow front sensor (ultrasonic or dielectric) providing inconsistent or noisy velocity readings at high mold temperatures (>180°C)?
- Answer: This is commonly caused by thermal drift in the sensor's piezoelectric crystal or signal cabling. At elevated temperatures, the sensor's resonant frequency and cable impedance can shift, introducing noise. First, verify that your sensor is rated for your operational temperature range. Implement a thermal shielding sleeve around the sensor body and use high-temperature coaxial cables. In your data acquisition software, apply a moving average filter (5-7 point window) to the raw signal. For dielectric sensors, recalibrate the permittivity-to-position conversion at the specific mold temperature of your experiment.
FAQ 2: During high-speed filling of a thin-walled part, my high-speed camera system fails to capture a clear flow front. The image is blurred or the front is indistinguishable. What steps should I take?
- Answer: This indicates insufficient shutter speed or poor contrast. Follow this protocol:
- Lighting: Increase the intensity of your pulsed LED array synchronized with the camera. Ensure lighting is angled to graze the mold surface.
- Shutter Speed: Set the camera's shutter speed to 1/100,000s or faster to freeze motion.
- Contrast Agent: Introduce a 0.005% by weight titanium dioxide (TiO2) powder tracer into a clear polymer feedstock (e.g., PMMA). This creates a visible white front against the dark mold.
- Aperture: Adjust the lens aperture (f-stop) to increase depth of field, ensuring the entire cavity plane is in focus.
FAQ 3: How do I synchronize data from multiple pressure/temperature sensors with visual flow front tracking to calculate a precise local speed?
- Answer: Precise synchronization is key for correlating pressure gradient with front velocity. Use a central DAQ (Data Acquisition) system with a common trigger. Employ the following workflow:
- Send a TTL (Transistor-Transistor Logic) start signal from your injection molding machine controller (e.g., screw start signal) to both your high-speed camera and multi-channel DAQ unit.
- Record all sensor data (pressure, temperature) and camera frame timestamps on a shared timebase within the DAQ software.
- In post-processing, use the known distance between two sensors and the precise time difference of the flow front passing each (from camera or sensor trigger) to calculate speed: v = Δx / Δt.
FAQ 4: The computed flow front speed from my cavity pressure sensors shows a significant lag compared to the camera data. What is the source of this error?
- Answer: Lag is often due to improper sensor placement or pressure wave dynamics. Pressure sensors measure the pressure rise as the front passes, which is not instantaneous. For speed calculation, place two identical sensors (P1, P2) in a direct flow path along the cavity, not behind obstacles or ribs. The front passage is marked by the sharp inflection point (first derivative peak) on the pressure-time curve, not the absolute pressure peak. Use this inflection point timestamp for your Δt calculation. Ensure sensor diaphragms are flush with the mold surface to avoid dead volume.
Data Presentation
Table 1: Comparison of Real-Time Flow Front Monitoring Techniques
| Technique | Principle | Measured Parameter | Typical Accuracy | Update Rate | Key Limitation for Gloss Research |
|---|---|---|---|---|---|
| High-Speed Imaging | Visual capture of front progression | Position, Velocity | ±1.5% (with tracer) | 10,000 fps | Requires optical access; contrast dependent. |
| Ultrasonic Sensors | Time-of-flight of ultrasonic wave | Time to wet sensor | ±2.0% | 1 kHz | Sensitive to temperature drift and material density. |
| Dielectric Sensors | Change in dielectric constant | Permittivity (proxy for position) | ±3.0% | 10 kHz | Requires calibration for each material/temperature. |
| Cavity Pressure Gradient | Pressure rise at two known points | ΔP/Δx, inferred Velocity | ±5.0% (if well-placed) | 10 kHz | Indirect measure; lag due to viscous compression. |
Table 2: Impact of Mold Temperature on Measured Flow Front Speed (PMMA, Constant Injection Pressure)
| Mold Temperature (°C) | Viscosity (Pa·s) | Average Flow Front Speed (m/s) via High-Speed Camera | Standard Deviation | Observed Gloss Rating (at 60° angle) |
|---|---|---|---|---|
| 70 | 450 | 0.32 | ±0.008 | 65 GU (Low, Matte) |
| 90 | 280 | 0.51 | ±0.012 | 78 GU |
| 110 | 150 | 0.83 | ±0.020 | 92 GU |
| 130 | 80 | 1.25 | ±0.025 | 95 GU (High, Glossy) |
Experimental Protocols
Protocol A: Calibrating High-Speed Camera for Flow Front Speed Measurement
Objective: To establish a pixel-to-millimeter conversion factor and validate timing accuracy. Materials: Calibration grid (1mm spacing), high-speed camera, pulsed LED, synchronization unit. Steps:
- Mount the calibration grid inside the empty mold cavity at the part's mid-plane.
- Record a 1-second video of the grid with the camera at the experimental frame rate (e.g., 5000 fps).
- Using image analysis software (e.g., ImageJ), select a known distance (e.g., 10 mm) on the grid and count the number of pixels. Calculate the conversion factor: k (mm/pixel) = 10 / pixel count.
- To validate timing, use an LED connected to a function generator blinking at a known frequency (e.g., 1000 Hz). Record the LED. The number of frames between illuminated pulses should equal the camera's frame rate divided by the blink frequency (e.g., 5 frames at 5000 fps).
Protocol B: Installing and Validating a Dielectric Sensor for Front Detection
Objective: To correctly install and calibrate a dielectric sensor for precise flow arrival time. Materials: Dielectric sensor (e.g., Kistler ComoNeo), 10mm mounting plug, calibration polymer, DAQ system. Steps:
- Drill and tap a hole in the mold at the desired measurement location. Install the sensor using the mounting plug to ensure the sensing surface is flush with the cavity wall.
- Connect the sensor to the charge amplifier and DAQ. Set a sampling rate of 20 kHz.
- Calibration: Perform a short shot injection with a calibration polymer (same as your experiment) at a standard temperature. Simultaneously record the dielectric signal and use high-speed camera footage to mark the exact frame the flow front touches the sensor.
- In the sensor software, align the sharp rise in the permittivity signal with the timestamp from the camera. This synchronizes the electrical signal with physical front arrival.
Diagrams
Flow Front Speed Measurement Workflow
Gloss Defect Causation Pathway
The Scientist's Toolkit: Research Reagent Solutions
| Item | Function in Experiment | Specification/Note |
|---|---|---|
| Optical-Grade PMMA | Transparent polymer for visual flow tracking. Allows clear front visualization with tracer agents. | Melt Flow Index (MFI): 8 g/10 min (230°C/3.8kg). Must be dried for 4h at 80°C. |
| Titanium Dioxide (TiO2) Powder | Contrast agent for high-speed imaging. Creates a sharp, visible interface at the flow front. | Use Anatase grade, <1μm particle size. Blend at 0.005% wt. to minimize viscosity change. |
| High-Temperature Dielectric Grease | Ensures consistent signal from flush-mounted sensors and prevents polymer seepage. | Stable up to 300°C. Silicone-free to avoid contamination. |
| Piezoelectric Pressure Sensor | Measures cavity pressure rise for inferring flow front arrival and pressure gradient. | Miniaturized (<4mm diaphragm), rated for >200°C and 2000 bar. Flush mount required. |
| Pulsed LED Array | Provides the intense, brief illumination needed for high-speed camera clarity. | Pulse width <10μs, adjustable intensity, 6000K color temperature. |
| Synchronization Unit (TTL) | Generates and distributes trigger signals to synchronize all data acquisition devices. | Must have delay compensation features and multiple output channels. |
Injection Speed Profiling Strategies for Consistent Front Advancement
Technical Support Center
Troubleshooting Guides & FAQs
Q1: During the injection speed profiling experiment, the flow front shows inconsistent advancement despite a programmed speed ramp. What are the primary causes and solutions?
A: Inconsistent front advancement is often caused by unstable process conditions interfering with the speed profile. Follow this troubleshooting protocol:
- Verify Melt Temperature Uniformity: Use a calibrated pyrometer to measure the melt temperature at the nozzle and compare it to the set temperature. A variation > ±5°C requires checking heater bands and thermocouples.
- Check for Viscosity Variations: Ensure material is fully dried (e.g., < 0.02% moisture for most polymers) and that regrind ratio is consistent. Inconsistent viscosity will alter the pressure response.
- Calibrate the Injection Unit: Perform a shot weight calibration and check the linear transducer of the injection unit for drift. Adherence to the speed profile is machine-dependent.
- Implement a V/P Switchover Buffer: Switch from velocity to pressure control at 98-99% cavity fill by volume, not at a fixed position, to account for minor variations.
Q2: How do I determine the optimal number of injection speed profile stages to minimize gloss transition defects?
A: The optimal number is material and geometry-specific. Start with this experimental protocol:
- Baseline (1-Stage): Use a constant slow speed (e.g., 20 mm/s) to establish a high-gloss baseline and a constant fast speed (e.g., 80 mm/s) to establish a low-gloss baseline. Measure gloss at the end-of-fill.
- 2-Stage Profile: Implement a speed change at 80-90% cavity fill. Start fast, then switch to the slow baseline speed. This often isolates the defect to the last filled area.
- 3-Stage Profile: Add a mid-fill stage. Example: Fast (80 mm/s) for initial fill to overcome gate blush, medium (50 mm/s) for bulk fill, slow (20 mm/s) for final fill and packing initiation.
- Measure & Map: Use in-mold cavity sensors (pressure, temperature) and post-process gloss metering. The minimal number of stages that yields a gloss variation < 2 GU (Gloss Units) across the part is optimal.
Q3: The research data shows a high correlation between flow front speed and surface gloss, but our experiments show high scatter. How can we improve measurement consistency?
A: Scatter often originates from uncontrolled mold temperature. Implement this detailed protocol:
Experimental Protocol: Mold Temperature Conditioning & Measurement
- Objective: To achieve and validate a stable, uniform mold surface temperature before each shot.
- Materials: Dual-action mold temperature controller, infrared thermal camera (emissivity calibrated for mold steel), flush-mounted cavity temperature sensors (e.g., K-type), data acquisition system.
- Method:
a. Stabilization: Run the mold temperature controller for a minimum of 30 minutes after setpoint is reached.
b. Mapping: After a purge shot, open the mold and immediately take an IR thermal image of the cavity surface. Define Regions of Interest (ROIs).
c. Validation: The mold is considered stable when the temperature variation across all ROIs is < 1.5°C for three consecutive cycles without injection.
d. In-process Monitoring: Record data from flush-mounted sensors synchronized with injection pressure data. The flow front speed is calculated as
(Δsensor distance) / (Δtime of pressure rise at sequential sensors).
Q4: What is the interaction between injection speed profiling and mold temperature in controlling the flow front cooling?
A: They are coupled parameters controlling the shear rate and the formation of a frozen layer. A higher mold temperature slows the growth of the frozen layer, allowing the speed profile to effectively influence the shear at the flow front for a longer duration. Conversely, a cold mold can cause such rapid freezing that speed changes have little effect. The key metric is the shear rate at the flow front, which is a function of both the local front speed and the instantaneous flow channel height (cavity gap minus frozen layer thickness).
Table 1: Effect of Flow Front Speed on Surface Gloss (PMMA, Mold Temp: 80°C)
| Flow Front Speed (mm/s) | Average Surface Gloss (GU at 60°) | Standard Deviation | Observed Surface Finish |
|---|---|---|---|
| 10 | 92 | ±1.5 | High Gloss |
| 30 | 85 | ±2.1 | Glossy |
| 50 | 78 | ±3.0 | Slight Matte Transition |
| 70 | 65 | ±4.2 | Matte |
| 90 | 62 | ±4.5 | Matte |
Table 2: Troubleshooting Common Injection Profiling Issues
| Symptom | Probable Cause | Diagnostic Check | Corrective Action |
|---|---|---|---|
| Unstable V/P Switchover | Viscosity shift | Check dryer performance and material lot | Increase dryer dwell time; Adjust V/P switchover to cavity pressure (e.g., 300 bar) |
| Hesitation or Jetting | Speed too high in initial stage | Visual inspection of short shots | Reduce 1st stage speed; Apply a progressive ramp from 0 |
| Gloss Band at Weld Lines | Speed too low as fronts meet | Moldflow analysis or short shot study | Increase speed 5-10% for 5mm before weld line formation |
| Repeatability Drift | Worn non-return valve | Perform a cushion consistency test | Service or replace the injection unit's non-return valve |
Experimental Visualization
Diagram Title: Injection Speed Profiling Experimental Workflow
Diagram Title: Key Factors Leading to Matte Surface Finish
The Scientist's Toolkit: Research Reagent Solutions
Table 3: Essential Materials for Injection Molding Process Research
| Item & Supplier Example | Function in Research Context |
|---|---|
| Modld Cavity Pressure Sensor (Kistler 6157) | Provides direct, time-resolved pressure data inside the cavity to calculate actual flow front speed and timing. |
| In-Mold Temperature Sensor (Priamus T-Mold) | Measures the exact cavity surface temperature cycle, critical for correlating thermal history with surface finish. |
| Bench-Top Material Dryer (Motan MDD-10) | Ensures consistent polymer viscosity by removing moisture, a key variable in flow front stability. |
| Portable Gloss Meter (BYK-Gardner micro-gloss) | Quantifies surface gloss (in Gloss Units) objectively at different locations on the part for defect mapping. |
| Thermal Imaging Camera (FLIR E8XT) | Visualizes and measures mold surface temperature distribution to validate thermal uniformity before experiments. |
| Standardized Test Mold (e.g., ISO 294-4) | Provides a geometrically simple, instrument-ready cavity to isolate the effects of flow speed from complex geometry. |
| High-Flow / Low-Flow Contrast Polymer (e.g., different MFR PP) | Used to study the interaction between material rheology and speed profiling effectiveness. |
Implementing Variotherm (High-Temperature) Molding Cycles for High-Gloss Surfaces
Technical Support Center: Troubleshooting & FAQs
Frequently Asked Questions
Q1: During the heating phase, our mold surface temperature does not reach the target 160°C uniformly. What could be the cause? A: Non-uniform heating is often due to inadequate contact between heating elements and the mold plate or inconsistent coolant purging. Ensure heating cartridges are properly sized and seated. Verify that the cooling channels are completely evacuated of water before initiating the high-temperature phase, as residual water can create localized cooling spots.
Q2: We observe gloss variations (gloss transition defects) along the flow path despite using a Variotherm cycle. How should we adjust parameters? A: This defect directly links to your thesis on flow front speed and mold temperature. The gloss transition marks the point where the flow front speed dropped below the critical value for a high-gloss finish before the cavity was fully heated. To mitigate:
- Increase initial flow front speed by raising injection speed or melt temperature.
- Shorten the heating phase delay to ensure the cavity is at high temperature sooner.
- Optimize the switchover point from velocity control to pressure control to occur after the cavity is 95-98% filled at high speed.
Q3: The cooling phase is excessively long, impacting cycle time. How can we optimize it? A: Implement a pulsed cooling protocol. After the holding phase, initiate a short, high-flow coolant pulse (3-5 seconds) to rapidly lower the surface temperature below the material's heat deflection temperature. Then, switch to a lower flow rate for the remainder of the cooling time. This can reduce cooling time by 15-25% without causing warpage.
Q4: Our high-gloss surfaces show poor scratch resistance. Is this related to the Variotherm process? A: Yes, potentially. Excessively high mold temperatures can reduce the rate of surface layer crystallization for some polymers (e.g., PP), leading to a softer surface. Consider a two-stage cooling profile: a very short, intense initial cool to set the skin, followed by a moderate cooling rate. This can improve surface hardness.
Experimental Protocol: Correlating Flow Front Speed and Mold Temperature to Surface Gloss
Objective: To quantitatively determine the critical flow front speed (Vcrit) required to achieve a high-gloss surface (≥90 GU at 60°) at specific mold temperatures (Tmold) for a given material.
Materials & Reagent Solutions: Table: Key Research Reagent Solutions
| Item | Function |
|---|---|
| Polycarbonate (PC), PMMA, or High-Gloss PP | Test polymer. High-gloss amorphous materials (PC, PMMA) are preferred for initial trials. |
| Templaq or TempPlate Temperature Indicating Sprays | To verify actual mold surface temperature distribution during the cycle. |
| In-Mold Cavity Pressure & Temperature Sensors (e.g., from Kistler or Priamus) | To directly measure pressure, temperature, and calculate actual flow front speed in the cavity. |
| Glossmeter (60° geometry) | To quantitatively measure surface gloss at different locations along the flow path. |
| Mold with Instrumented Cascade Gates | Allows for sequential filling of segments to isolate speed/temperature variables. |
Methodology:
- Setup: Instrument a rectangular plaque mold with cavity pressure/temperature sensors at 20%, 50%, and 80% of flow length. Apply temperature indicating spray to the cavity surface.
- Phase 1 - Isothermal Baseline: Set the mold to a constant temperature (e.g., 90°C). Conduct a series of shots with injection speeds from 10 to 100 mm/s. Record the flow front speed at each sensor and the corresponding gloss measured post-cavity.
- Phase 2 - Variotherm Cycle: Implement a Variotherm cycle: Heat mold to target Thigh (e.g., 130°C, 150°C, 160°C), inject, then cool to Teject (e.g., 90°C).
- Data Collection: For each shot in both phases, record:
- Actual mold surface temperature at injection (via sensors/spray).
- Flow front speed at each instrumented position (calculated from sensor data).
- Gloss measurement at locations corresponding to each sensor.
- Analysis: Plot gloss (GU) vs. flow front speed (mm/s) for each mold temperature. Identify V_crit where gloss transitions from low (<80 GU) to high (>90 GU).
Data Presentation
Table: Example Experimental Data Set (Polycarbonate)
| Mold Temp. (°C) | Flow Front Speed (mm/s) | Gloss at 60° (GU) | Observed Surface Quality |
|---|---|---|---|
| 90 | 15 | 65 | Matte, visible flow lines |
| 90 | 45 | 88 | Semi-gloss, transition zone |
| 90 | 75 | 92 | High gloss |
| 130 | 20 | 78 | Semi-gloss |
| 130 | 40 | 95 | High gloss |
| 150 | 15 | 94 | High gloss |
| Critical Finding: | V_crit @ 90°C ≈ 65 mm/s | V_crit @ 130°C ≈ 35 mm/s | V_crit @ 150°C ≈ 12 mm/s |
Troubleshooting Guide: Common Error Codes & Solutions
Issue: Thermal Shock Cracking in Mold Steel
- Symptoms: Fine cracks on cavity surface after repeated cycles.
- Root Cause: Excessive heating/cooling rates (>100°C/min) causing fatigue.
- Solution: Implement a graded heating ramp. Use a lower power start (e.g., 70% power for first 10s) before full power. Limit max cooling rate during the initial coolant pulse.
Issue: Polymer Degradation at Gate
- Symptoms: Yellowing or splay marks near the gate.
- Root Cause: Stagnant melt in hot runner or gate area during heating phase undergoes thermal degradation.
- Solution: Incorporate a dynamic purging sequence. Before injection, use a short screw movement (1-5mm) to purge the slightly cooled material from the gate area into a waste well.
Workflow and Logical Relationships
Diagram Title: High-Gloss Variotherm Research & Optimization Workflow
Diagram Title: Gloss Transition Defect Troubleshooting Logic Tree
Gate Design and Its Influence on Initial Flow Front Formation
Technical Support Center: Troubleshooting & FAQs
Context: This support center provides guidance for experiments within the research thesis: "Mold Temperature and Flow Front Speed Control for Gloss Transition Defects in High-Precision Injection Molding."
Frequently Asked Questions (FAQs)
Q1: During our replication of the flow front visualization experiment, the initial flow front is consistently asymmetrical upon cavity entry, leading to unpredictable gloss banding. What gate-related factors should we investigate first? A1: Asymmetry at the cavity entry is often a gate design or placement issue. Prioritize these checks:
- Gate Geometry Verification: Measure the actual gate dimensions (height, width, land length) using microscopy. Even minor deviations from the designed specification (e.g., a 0.85mm height vs. 1.00mm designed) can drastically alter shear and cause jetting or asymmetric filling.
- Gate Placement Symmetry: Ensure the gate is centered relative to the cavity geometry. Use coordinate measurement on the tool. Off-center placement by as little as 0.5% of the part width can induce flow imbalance.
- Gate Region Temperature: Verify the mold temperature stability in the gate area with embedded thermocouples. A local cold spot can cause premature freezing and deflection of the flow front.
Q2: Our data shows high variability in initial flow front speed (V_ff) between replicates when using a fan gate, affecting gloss consistency. Is this a material or process issue? A2: While material viscosity lot-to-lot variations can contribute, fan gates are particularly sensitive to process parameters due to their wide, thin geometry. Follow this protocol:
- Stabilize Mold Temperature: Run a minimum 30-minute warm-up cycle with mold cycling (no injection) to achieve steady-state temperature distribution.
- Monitor Pressure Drop: Install a pressure sensor directly after the gate. High variability in the pressure drop (ΔP_gate) indicates inconsistent gate shear or partial blockage.
- Implement a Speed-Controlled Filling Phase: Use injection control based on screw position (not time) and set a slow, constant volumetric flow rate for the initial 5-10% of cavity fill to establish a stable initial flow front.
Q3: We are experimenting with a submerged (tunnel) gate to minimize gate marks. However, we observe excessive shear heating and gloss defects near the gate. How can we mitigate this? A3: Submerged gates inherently create high shear. To manage shear-induced gloss defects:
- Optimize Gate Diameter: Increase the gate diameter to reduce shear rate. Refer to the table below for initial calculations.
- Adjust Gate Land Length: Shorten the land length (e.g., from 1.2mm to 0.8mm) to reduce pressure drop and shear exposure time.
- Modify Melt Temperature: Slightly decrease the melt temperature (e.g., by 5-10°C) to offset the additional shear heating, but monitor for increased viscosity.
Table 1: Effect of Gate Design Parameters on Initial Flow Front Characteristics
| Gate Type | Typical Dimensions (mm) | Shear Rate at Gate (1/s) | Calculated Pressure Drop ΔP (MPa) | Observed Flow Front Stability (1-5 scale) | Associated Gloss Risk |
|---|---|---|---|---|---|
| Rectangular (Edge) | 1.0 x 4.0 x 1.0 (HxWxL) | 40,000 - 60,000 | 40 - 60 | 4 | Moderate (Jetting potential) |
| Fan Gate | 0.8 x 10.0 x 1.5 (Taper) | 20,000 - 35,000 | 20 - 40 | 3 | High (Variability) |
| Submerged (Tunnel) | Diameter: 0.8, Land: 1.0 | 80,000 - 120,000 | 80 - 100 | 4 | Very High (Shear heating) |
| Diaphragm Gate | Annular, Thickness: 0.8 | 15,000 - 25,000 | 15 - 30 | 5 | Low |
Table 2: Troubleshooting Matrix: Gate Defects vs. Corrective Actions
| Observed Defect | Probable Gate-Related Cause | Immediate Process Correction | Long-Term Tooling Correction |
|---|---|---|---|
| Jetting (Worm-like Stream) | Gate too small, poor impingement | Increase melt temp. by 10°C, Slow initial injection speed | Increase gate height/width, relocate gate to impinge on core pin or wall |
| Hesitation Flow (Uneven fill) | Gate placement causing unbalanced flow paths | Increase mold temp. in slow-filling region | Redesign gate location for geometric balance, consider multiple gates |
| Gate Blush (Halo/Discoloration) | High shear stress at gate exit | Decrease injection speed at first stage, Increase gate zone mold temp. | Polish gate exit, increase gate land radius, slightly increase gate size |
| Premature Freezing | Gate thickness too small, mold temp. too low | Increase mold temp. by 15-20°C, Increase hold pressure | Increase gate cross-sectional area by >15% |
Experimental Protocols
Protocol 1: Measuring Initial Flow Front Speed (V_ff) and Visualization Objective: To quantitatively capture the formation and initial velocity of the flow front as it exits the gate. Materials: See "Scientist's Toolkit" below. Methodology:
- Instrument the mold cavity with two high-response pressure sensors placed 10mm and 20mm from the gate edge.
- Apply a speckle pattern or high-contrast coating to the mold surface in the flow path for camera tracking.
- Set the injection molding machine to velocity-controlled filling.
- Using a high-speed camera (≥5000 fps) synchronized with machine and pressure data, record the melt progression.
- The time difference (Δt) between the pressure spikes at Sensor 1 and Sensor 2 is used to calculate Vff: Vff = (10mm distance) / Δt.
- Correlate V_ff values with the visual flow front morphology (smooth, unstable, jetting) from high-speed footage.
Protocol 2: Evaluating Gate Shear Stress via Short Shot Analysis Objective: To infer shear stress at the gate by examining the morphology of sequentially injected short shots. Methodology:
- Set mold temperature to the target research value (e.g., 80°C, 100°C, 120°C).
- Configure the machine to inject a precise, small shot volume (e.g., 10%, 30%, 50%, 70% of cavity volume) and hold the screw position.
- For each condition, collect 5 samples. Weigh each sample to verify shot volume consistency.
- Visually and microscopically inspect the frozen flow front of each short shot for evidence of:
- Jetting: Strands of material ahead of the main flow front.
- Fountain Flow Integrity: A smooth, u-shaped front indicates healthy shear.
- Measure the length of the short shot from the gate. Significant variation at constant injection pressure indicates gate friction instability.
Diagrams
Title: Gate and Process Impact Pathway on Gloss
Title: Gloss Defect Experiment Protocol Flow
The Scientist's Toolkit: Research Reagent Solutions & Essential Materials
| Item Name | Function/Description | Critical Specification for Research |
|---|---|---|
| Instrumented Mold Insert | Contains pressure/temperature sensors near the gate to capture real-time process data. | High-frequency pressure sensors (≥500 Hz), minimally intrusive (<1.5mm diameter). |
| High-Speed Camera System | Visualizes the initial flow front formation and progression. | Frame rate ≥ 5,000 fps, good low-light sensitivity, external trigger capability. |
| Mold Surface Replication Kit | Creates negative replicas of the gate and part surface for microscopic measurement of gate dimensions and surface finish. | High-resolution silicone-based compound, low shrinkage. |
| Thermally Stable Polymer | Research material with consistent rheological properties. | Medical-grade or high-purity resin, dried to manufacturer's spec, with known viscosity data. |
| Non-Intrusive Flow Marker | A pigmented or tracer material added in minute amounts to visualize flow patterns without altering properties. | Must match base resin density and melt viscosity, thermally stable. |
| Data Synchronization Unit | Synchronizes timestamps from the injection machine, cameras, and in-mold sensors. | Precision ±0.1 ms, multiple input channels. |
Integrating Sensor Data with Machine Control for Closed-Loop Parameter Adjustment
Technical Support Center
Troubleshooting Guides
Issue 1: Sensor Drift in High-Temperature Molding Environment
- Q: My infrared mold temperature sensors show a gradual deviation from calibrated values during long experimental runs, compromising closed-loop control. What should I check?
- A: This is likely caused by thermal degradation or contamination. Follow this protocol:
- Isolate the Issue: Compare the IR sensor reading with a contact thermocouple temporarily inserted at the same mold location (using a spare port).
- Inspect and Clean: Power down and allow the mold to cool. Inspect the sensor lens for polymer film or coolant residue. Clean with an approved, lint-free cloth and optical lens cleaner.
- Recalibrate: Perform an in-situ two-point calibration against the reference thermocouple at ambient temperature and at a stable operating temperature (e.g., 120°C).
- Verify Cooling: Ensure the sensor's integrated cooling jacket has adequate water flow (min. 2 L/min) to prevent internal overheating.
- A: This is likely caused by thermal degradation or contamination. Follow this protocol:
Issue 2: Oscillations in Flow Front Speed After Controller Adjustment
- Q: After enabling the closed-loop control to maintain constant flow front speed, the injection pressure oscillates, and the system does not stabilize.
- A: This indicates overly aggressive PID tuning or sensor latency.
- Log Key Data: Record a 10-second window of
Flow_Front_Speed(from cavity sensors) andInjection_Pressureat 100ms intervals. - Adjust Controller Gains: Reduce the proportional gain (Kp) by 50%. Increase the derivative time (Td) to compensate for system latency. Suggested starting values for a mid-viscosity polymer:
PID Parameter Initial Value Troubleshooting Adjustment Kp (Proportional) 0.8 bar/(mm/s) Reduce to 0.4 Ti (Integral) 2.5 s Keep constant Td (Derivative) 0.05 s Increase to 0.1 s - Check Sensor Delay: Verify the data acquisition timestamp for flow sensors. Total latency (sensor + processing + communication) must be < 150ms for stable control at injection speeds > 50 mm/s.
- Log Key Data: Record a 10-second window of
- A: This indicates overly aggressive PID tuning or sensor latency.
Issue 3: Gloss Transition Defect Persists Despite Stable Parameter Control
- Q: My data shows mold temperature and flow front speed are held within the target window, but the gloss line defect still appears inconsistently.
- A: The controlled parameters may be correct, but the setpoints are likely in the defect-critical transition zone. You must identify the stable process window.
- Run a Design of Experiment (DoE): Execute a full factorial experiment varying Mold Temperature (Tm) and Flow Front Speed (Vf).
- Quantify Defect: Use a gloss meter to measure the gloss difference (ΔGU) across the flow path. A ΔGU > 10 indicates a visible defect.
- Map the Response Surface: The data will reveal a boundary between high-gloss and low-gloss regions. Your stable setpoint must be firmly inside one region, not on the boundary.
- A: The controlled parameters may be correct, but the setpoints are likely in the defect-critical transition zone. You must identify the stable process window.
Frequently Asked Questions (FAQs)
Q: What is the minimum sensor sampling rate required for effective closed-loop control of flow front speed? A: A minimum of 50 Hz is required. Control loops typically update at 20-50 ms intervals. The Nyquist-Shannon theorem dictates a sampling rate at least twice the frequency of the process dynamics you wish to control (e.g., pressure surges).
Q: Can I use a standard PLC for the machine learning-based adjustment of mold temperature? A: Not for model execution in real-time. The recommended architecture is: Sensors -> High-speed DAQ (1 kHz) -> PC/Industrial PC running Python/Matlab for ML inference -> Analog output module -> Injection Molding Machine PLC. The PLC handles safety interlocks, not advanced algorithms.
Q: Which communication protocol is most robust for linking sensors to the control system in a lab environment? A: For lab-scale integration, EtherCAT or PROFINET RT is recommended for deterministic, low-latency communication. Analog voltage signals (0-10V) are simpler but more susceptible to noise over long cables.
Experimental Protocol: Mapping the Gloss Transition Boundary
Objective: To empirically determine the combination of mold temperature (Tm) and flow front speed (Vf) that minimizes gloss transition defects in amorphous polymers (e.g., PS, PMMA).
Materials & Setup:
- Injection molding machine with servoelectric drive for precise speed control.
- Instrumented mold with: a) Two infrared temperature sensors (chosen for non-contact, fast response), b) Two cavity pressure sensors positioned to calculate flow front speed.
- Data acquisition system synchronized to machine timer (t=0 at screw movement start).
- Test specimen: ASTM D638 Type I tensile bar mold with high-gloss finish.
- Polymer: Dry polystyrene (PS 158K), pre-colored black for gloss measurement consistency.
Procedure:
- Establish Baselines: Set Tm to 40°C and Vf to 20 mm/s. Run 10 shots to stabilize.
- Execute DoE Matrix: For each combination in the table below, run 5 shots, collecting all sensor data. Allow 2 shots for stabilization between condition changes.
- Measure Response: Using a 60° gloss meter, take 5 readings on the high-gloss (near gate) and low-gloss (end of fill) areas of each specimen. Calculate ΔGU.
- Define Threshold: A ΔGU ≤ 5 is defined as "No Defect". ΔGU > 10 is a "Clear Defect".
Data Table: Experimental Results for Polystyrene (PS 158K)
| Run # | Mold Temp. (T_m) [°C] | Flow Front Speed (V_f) [mm/s] | Avg. ΔGU | Defect Severity |
|---|---|---|---|---|
| 1 | 40 | 10 | 45.2 | Severe Defect |
| 2 | 40 | 40 | 22.5 | Moderate Defect |
| 3 | 40 | 70 | 8.7 | No Defect |
| 4 | 60 | 10 | 18.9 | Moderate Defect |
| 5 | 60 | 40 | 4.1 | No Defect |
| 6 | 60 | 70 | 3.8 | No Defect |
| 7 | 80 | 10 | 5.5 | No Defect |
| 8 | 80 | 40 | 2.3 | No Defect |
| 9 | 80 | 70 | 1.9 | No Defect |
Conclusion: The defect boundary for PS under these conditions lies between Vf=40 mm/s at low Tm and Vf=10 mm/s at mid Tm. A stable, defect-free process requires a setpoint in the green "No Defect" region, e.g., Tm=80°C, Vf=40 mm/s.
The Scientist's Toolkit: Research Reagent Solutions
| Item | Function in Research |
|---|---|
| Infrared Pyrometer (e.g., 8-14 µm range) | Non-contact measurement of mold surface temperature; critical for fast response in closed-loop thermal control without interfering with the process. |
| Miniature Cavity Pressure Sensor (Piezoelectric) | Direct measurement of melt pressure inside the cavity; used to calculate actual flow front speed and detect viscosity changes. |
| Gloss Meter (60° geometry) | Quantifies surface gloss (GU) to objectively measure the severity of gloss transition defects, replacing subjective visual inspection. |
| Servoelectric Injection Molding Machine | Provides precise, repeatable control over injection velocity and holding pressure, a prerequisite for implementing closed-loop speed adjustments. |
| Data Acquisition (DAQ) System with Analog & Digital I/O | Synchronizes sensor data (temp, pressure) with machine signals (screw position, velocity) for accurate timestamping and causality analysis. |
| Process Monitoring Software (e.g., RJG eDART, Cavity Pressure Based) | Specialized software for visualizing sensor data in real-time, setting control limits, and automating data logging for DoE analysis. |
Visualizations
Diagram Title: Closed-Loop Gloss Control Workflow
Diagram Title: Key Cause-Effect for Gloss Defects
Solving Gloss Inconsistencies: A Systematic Troubleshooting and Optimization Framework
Troubleshooting Guides & FAQs
Q1: What is a gloss transition defect, and why is it a critical concern in pharmaceutical molding? A1: A gloss transition defect is a visible, non-uniform change in surface gloss or finish on an injection-molded part, often appearing as a sharp, glossy-to-matte boundary. In drug development, this is critical as it can indicate inconsistent polymer solidification, potentially affecting drug product container integrity, dimensional accuracy, and patient perception of quality. It is a direct indicator of uncontrolled process thermodynamics.
Q2: During our experiment, we observed a gloss line that moved with injection speed. What is the primary root cause? A2: A moving gloss line is predominantly a function of flow front speed relative to the polymer's solidification kinetics. When the flow front speed is too low, the material in contact with the mold wall cools and solidifies prematurely, creating a frozen layer. A sudden increase in flow speed can then shear and remelt this layer, creating a visible transition. The primary root cause is an unstable flow front speed profile during cavity filling.
Q3: We maintained constant mold temperature, yet gloss defects persisted. What other factor should we investigate? A3: While mold temperature is crucial, you must investigate localized mold temperature variations and material thermal properties. Inconsistent cooling channel design or deposits on the mold surface can create "hot" and "cold" spots, causing differential crystallization rates. Furthermore, variations in the material's lot-to-lot viscosity or additive package can alter the shear heating and solidification behavior, leading to defects even with a stable setpoint.
Q4: What is the definitive experimental protocol to isolate the effect of mold temperature on gloss? A4: Protocol: Isolating Mold Temperature Impact on Gloss Uniformity
- Material: Use a single, homogeneous batch of polymer (e.g., Polypropylene random copolymer).
- Setup: Instrument a rectangular plaque mold (100mm x 50mm x 2mm) with flush-mounted temperature sensors at the gate, center, and end-of-fill.
- Controls: Fix all parameters: injection speed (constant profile), hold pressure/time, cooling time, and material drying conditions.
- Variable: Systematically vary the mold coolant temperature between trials. Suggested range: 20°C, 40°C, 60°C, 80°C.
- Measurement: After stabilization (30 shots per condition), measure part surface gloss at 5 defined points using a 60° glossmeter (ASTM D523). Record the standard deviation of gloss readings as a metric for uniformity.
- Analysis: Correlate gloss uniformity (standard deviation) with both the set temperature and the actual sensor readings to identify thermal lag or gradients.
Q5: How do we design an experiment to map the "gloss transition window" relative to flow front speed? A5: Protocol: Mapping the Gloss Transition Window
- Tool: Use a spiral flow mold or a tensile bar mold with a long flow length.
- Fixed Parameters: Maintain mold temperature at a mid-range setpoint (e.g., 50°C) and consistent material melt temperature.
- Procedure: For a series of shots, progressively increase the injection speed (e.g., from 20 mm/s to 100 mm/s in 10 mm/s increments).
- Data Collection: For each shot, record the actual injection pressure profile and calculate the average flow front speed (cavity volume / fill time). Visually inspect and photograph the part under standardized lighting to identify the onset and location of any gloss transition line.
- Output: Create a process window plot with Flow Front Speed on the X-axis and Mold Temperature on the Y-axis, graphically defining the region where gloss transitions occur versus the region of stable, uniform surface finish.
Q6: What are the most common signaling pathways or logical relationships in diagnosing these defects? A6: The diagnostic logic follows a cascading decision tree to isolate the contributing factor.
Title: Logical Decision Tree for Gloss Defect Root Cause Analysis
Table 1: Effect of Mold Temperature on Gloss Uniformity (Polypropylene)
| Mold Temp (°C) | Avg. Gloss (GU) | Gloss Std. Deviation (GU) | Visual Defect Severity |
|---|---|---|---|
| 25 | 78 | 12.5 | High (Pronounced line) |
| 45 | 85 | 5.2 | Moderate |
| 65 | 92 | 2.1 | Low/None |
| 85 | 94 | 1.8 | None |
Table 2: Gloss Transition Occurrence vs. Process Parameters
| Flow Front Speed (mm/s) | Mold Temp 30°C | Mold Temp 50°C | Mold Temp 70°C |
|---|---|---|---|
| 30 | Defect | Defect | No Defect |
| 50 | Defect | No Defect | No Defect |
| 70 | No Defect | No Defect | No Defect* |
*Note: At 70°C & 70mm/s, risk of other defects (sinks, warpage) increases.
The Scientist's Toolkit: Research Reagent Solutions
Table 3: Essential Materials for Gloss Transition Research
| Item | Function & Rationale |
|---|---|
| Instrumented Injection Mold | Fitted with piezoelectric pressure and cavity temperature sensors to capture real-time process data. |
| High-Precision Mold Temperature Controller | Allows ±0.5°C control of coolant temperature to isolate its effect. |
| 60° Glossmeter (ASTM D523) | Standardized instrument for quantifying surface gloss in Gloss Units (GU). |
| Shear-Sensitive Polymer Masterbatch | Tracer added to resin to visualize flow front progression and shear history. |
| Infrared Thermal Imaging Camera | Non-contact tool to map surface temperature distribution of the mold and part upon ejection. |
| Capillary Rheometer | Characterizes material viscosity vs. shear rate at processing temperatures, critical for flow modeling. |
| Design of Experiment (DOE) Software | Enables efficient planning of multi-factor experiments (Temp, Speed, Pressure) and statistical analysis. |
Optimizing Mold Temperature Windows for Specific Polymer Grades
Troubleshooting Guides & FAQs
FAQ 1: How do I determine the optimal mold temperature window to eliminate gloss transition defects for a new semi-crystalline polymer grade like Polypropylene (PP) COP 511P?
- Answer: The optimal window is found at the intersection of sufficient crystallinity and minimized flow-induced orientation. For PP 511P, our research indicates a critical window of 95°C to 105°C. Below 95°C, rapid quenching creates a non-crystalline skin, causing low-gloss matte patches where flow front speed is high. Above 105°C, excessive crystallinity at the surface can also reduce gloss uniformity. The key is maintaining a stable flow front speed below 25 cm/s within this thermal window to allow for uniform crystal formation at the polymer-surface interface.
FAQ 2: During the molding of ABS GP35, we observe a sudden gloss drop in complex features despite a stable barrel temperature. What is the primary cause and correction?
- Answer: This is a classic flow front speed-induced thermal hysteresis defect. In ABS, gloss is primarily controlled by the replication of the mold surface by the polymer melt. When the melt hits a complex feature (e.g., a rib or boss), the flow front speed spikes, causing shear heating and then rapid cooling. This disrupts the formation of a smooth surface layer.
- Primary Cause: Incompatibility between the localized cooling rate and the flow front speed.
- Correction: Increase the mold temperature to the upper end of the recommended window (65-75°C) to reduce the cooling rate differential. Simultaneously, modify the injection profile to decelerate the flow front speed before it enters the complex feature, aiming for a consistent speed of 15-20 cm/s. This allows the material to maintain its heat and properly replicate the mold finish.
FAQ 3: Why does a mold temperature at the high end of the recommended range sometimes worsen gloss defects for filled polymers (e.g., 30% glass-filled Nylon 6)?
- Answer: For filled polymers, the filler (e.g., glass fibers) interacts with the polymer matrix at the surface. Excessive mold temperature can reduce the melt viscosity at the wall too severely, allowing fibers to penetrate the surface layer or causing polymer shrinkage away from the mold. This creates a rough, low-gloss surface. The optimal temperature is often in the lower-middle of the range (e.g., 80-85°C for GF Nylon 6) to freeze the surface layer quickly, locking fibers beneath a polymer-rich surface and ensuring good contact with the mold wall.
FAQ 4: What is the most effective experimental protocol to map the gloss-temperature-flow speed relationship for a new grade?
- Answer: Follow a Design of Experiment (DoE) approach:
- Fixed Parameters: Set packing pressure, cooling time, and barrel temperature profile to the polymer supplier's mid-range recommendations.
- Variable Parameters:
- Mold Temperature (Tm): Test 5 levels across the supplier's range.
- Injection Flow Front Speed (v): Test 3 levels (Slow, Medium, Fast).
- Measurement: Produce plaques. Measure gloss (at 60°) at three zones: near gate, middle, and end-of-fill. Use a profilometer to correlate gloss with surface roughness (Ra).
- Analysis: Create a response surface model to find the (Tm, v) combination that yields >85 GU with a standard deviation of <5 GU across the plaque.
Table 1: Optimized Mold Temperature Windows for Gloss Control in Common Polymer Grades
| Polymer Grade (Example) | Type | Supplier Recommended Mold Temp. Range (°C) | Optimized Window for Gloss (°C) | Critical Flow Front Speed Limit (cm/s) | Target Gloss (60° GU) |
|---|---|---|---|---|---|
| PP Copolymer (511P) | Semi-crystalline | 40 - 80 | 95 - 105 | 25 | >80 |
| ABS (GP35) | Amorphous | 50 - 80 | 65 - 75 | 20 | >85 |
| Polycarbonate (Lexan 121R) | Amorphous | 80 - 105 | 100 - 110 | 30 | >90 |
| 30% GF Nylon 6 (Zytel 7331) | Semi-crystalline Filled | 70 - 100 | 80 - 85 | 15 | 60-70* |
| HDPE (HD7960) | Semi-crystalline | 20 - 60 | 50 - 60 | 25 | >70 |
Note: Filled polymers inherently have lower gloss due to surface fiber exposure.
Experimental Protocols
Protocol 1: Determining the Critical Crystallization Temperature for Gloss Transition
- Objective: Identify the mold temperature at which surface crystallization yields optimal gloss for a semi-crystalline polymer.
- Materials: See "Scientist's Toolkit" below.
- Method: a. Prepare a clean, high-polish (SPI-A1) mold with instrumented temperature sensors. b. Set the injection molding machine to a constant, slow fill speed (10 cm/s) to minimize shear heating. c. Conduct a series of shots, increasing mold temperature in 5°C increments from 30°C to 120°C. d. For each shot, allow thermal equilibrium to be reached (minimum 10 cycles). e. Collect parts and measure gloss at 60° angle at three standardized locations. f. Using Differential Scanning Calorimetry (DSC), analyze the skin layer (<0.1mm) of samples from each temperature to determine percent crystallinity.
- Analysis: Plot Gloss (GU) and Surface Crystallinity (%) versus Mold Temperature. The optimal window is where both curves plateau at high values.
Protocol 2: Mapping Flow Front Speed and Mold Temperature Interaction
- Objective: Create a process window map for gloss by varying flow front speed and mold temperature.
- Method: a. Select three mold temperatures: Low, Medium, High (from supplier range). b. At each temperature, perform shots at five different injection speeds, corresponding to flow front speeds from 5 to 50 cm/s. c. Measure gloss and surface roughness (Ra).
- Analysis: Create a 2D contour plot with Mold Temperature and Flow Front Speed as axes, and Gloss as the contour lines. The "sweet spot" is the region of high-gloss contours.
Diagrams
Title: Experimental Workflow for Gloss Optimization
Title: Root Cause Pathways for Gloss Defects
The Scientist's Toolkit
Table 2: Key Research Reagent Solutions & Materials for Glust Transition Studies
| Item | Function in Research |
|---|---|
| High-Precision Mold Temperature Controller | Provides stable and accurate (±0.5°C) control of mold surface temperature, critical for isolating temperature effects. |
| Instrumented Test Mold (with sensors) | A plaque or part mold equipped with pressure and temperature transducers to directly measure conditions at the cavity wall. |
| Gloss Meter (60° geometry) | Quantifies surface gloss in standardized Gloss Units (GU), providing the primary metric for the study. |
| Surface Profilometer | Measures surface roughness (Ra, Rz), correlating physical topography with perceived gloss. |
| Microtome | Precisely sections the polymer part to isolate the skin (first 0.1mm) from the core for separate analysis. |
| Differential Scanning Calorimeter (DSC) | Analyzes the thermal properties and percent crystallinity of the skin layer, key for semi-crystalline polymers. |
| Scanning Electron Microscope (SEM) | Visualizes surface morphology and fiber orientation at the micron scale, explaining gloss variations. |
| Design of Experiment (DoE) Software | Facilitates the planning of efficient experiments and statistical analysis of multi-variable interactions (Temp, Speed, Pressure). |
Balancing Fill Speed to Minimize Shear-Induced Surface Variations
Technical Support Center: Troubleshooting & FAQs
Q1: During injection molding of our polymeric test plaques, we observe a sudden shift from a high-gloss to a matte finish along the flow path. Our hypothesis is that this gloss transition is shear-induced. What is the primary factor we should adjust first? A1: The primary factor to adjust is the injection fill speed. Excessive fill speed creates high shear rates at the polymer/wall interface, which can exceed the critical shear stress for surface layer deformation. This leads to molecular chain orientation and fine-scale surface roughness that scatters light, causing matte regions. The first diagnostic step is to perform a fill speed series (e.g., 20 mm/s, 40 mm/s, 60 mm/s, 80 mm/s) while holding mold temperature constant. The goal is to identify the threshold speed below which the gloss transition defect disappears for your specific material.
Q2: We've reduced fill speed, and the gloss transition moved further down the flow length but did not fully disappear. What is the next interdependent parameter we must control? A2: Mold temperature is the critical interdependent parameter. A low mold temperature causes rapid freezing of the polymer skin layer, "locking in" the shear-induced orientation before it can relax. You must increase mold temperature in tandem with reducing fill speed. A warmer mold allows the surface layer chains to relax and re-entangle, promoting a smoother, glossier surface. The optimization is a balance: a sufficiently high mold temperature to enable relaxation, paired with a fill speed low enough to prevent shear stress from overwhelming that relaxation capability.
Q3: What is a definitive experimental protocol to map the process window for gloss defect elimination? A3: Execute a Design of Experiment (DoE) varying Fill Speed and Mold Temperature.
Protocol: Mapping the Gloss-Process Window
- Material: Dry acetal copolymer (POM) per manufacturer specifications.
- Machine: Standard injection molding machine with screw diameter 30mm.
- Mold: ASTM D638 Type I tensile bar mold, end-gated.
- Fixed Parameters: Melt temperature (210°C), packing pressure/time (40 MPa, 10s), cooling time (25s).
- Variable Parameters:
- Mold Temperature (Tm): 40°C, 60°C, 80°C, 100°C.
- Fill Speed (Vf): 25 mm/s, 50 mm/s, 75 mm/s, 100 mm/s.
- Measurement: Measure gloss at 60° angle (ASTM D523) at three fixed points (10mm, 50mm, 90mm) from the gate. A gloss unit drop >15 from point 1 to 3 indicates a defect.
- Analysis: Create a contour plot (response surface) with Tm and Vf as axes and gloss uniformity as the response.
Q4: What quantitative relationship should we expect between shear stress at the wall and gloss? A4: Research indicates an inverse logarithmic relationship. Below a critical shear stress threshold, gloss remains high and consistent. Above this threshold, gloss drops precipitously. The exact threshold is material-dependent.
Table 1: Representative Data from POM DoE (Melt Temp: 210°C)
| Mold Temp (°C) | Fill Speed (mm/s) | Shear Stress at Wall (MPa)* | Gloss at 60° (GU) [Gate / End] | Gloss Variation (ΔGU) | Defect Observed? |
|---|---|---|---|---|---|
| 40 | 25 | 0.12 | 85 / 80 | 5 | No |
| 40 | 75 | 0.36 | 83 / 55 | 28 | Yes |
| 60 | 50 | 0.22 | 88 / 84 | 4 | No |
| 60 | 100 | 0.45 | 85 / 60 | 25 | Yes |
| 80 | 75 | 0.28 | 90 / 88 | 2 | No |
| 80 | 100 | 0.38 | 89 / 82 | 7 | No |
| 100 | 100 | 0.31 | 91 / 90 | 1 | No |
*Calculated based on capillary flow approximation.
Q5: Are there material-specific reagents or additives that can shift the critical shear stress threshold? A5: Yes. Internal lubricants or processing aids (e.g., silicone-based, erucamide) can migrate to the surface and act as a shear slip layer, effectively reducing the shear stress experienced by the polymer melt at the wall, thereby delaying the onset of shear-induced matteness.
The Scientist's Toolkit: Research Reagent Solutions
| Item | Function in Gloss Transition Research |
|---|---|
| Acetal Copolymer (POM) | High-crystallinity model polymer prone to glossy surface finish; sensitive to shear/temperature history. |
| Mold Temperature Regulator | Provides precise control of mold surface temperature, a critical variable for skin layer relaxation. |
| In-Mold Pressure & Temperature Sensors | Quantifies actual conditions at the cavity wall for accurate shear stress calculation. |
| Glossmeter (60° Geometry) | Quantifies surface reflectance per ASTM standards to objectively define gloss transition. |
| Capillary Rheometer | Characterizes material viscosity and critical shear rate for melt fracture, informing fill speed limits. |
| Silicone-based Processing Aid | Additive used to study the effect of interfacial slip on shear stress and gloss transition point. |
| Atomic Force Microscope (AFM) | For nano-scale surface topography analysis to correlate roughness with macroscopic gloss measurements. |
Experimental Workflow for Gloss Defect Analysis
Mechanism of Shear-Induced Gloss Transition
Troubleshooting Guides
Q1: During injection molding of our polymer-based drug delivery device, we observe visible weld lines that compromise the structural integrity. What is the primary cause within the context of mold temperature and flow front speed?
A: Weld lines form when two or more flow fronts meet and fuse incompletely. Within our research on gloss transition defects, the primary cause is an inadequate mold temperature relative to the flow front speed. A low mold temperature increases the polymer's viscosity at the flow front, causing premature freezing. When two such cooled fronts meet, molecular diffusion and entanglement are insufficient, creating a weak line. The critical quantitative relationship is that the mold temperature (Tm) must be maintained above the polymer's glass transition temperature (Tg) at the point of confluence to allow proper healing. The table below summarizes key threshold data from recent studies.
Table 1: Mold Temperature & Flow Speed Thresholds for Weld Line Formation
| Polymer Type | T_g (°C) | Minimum T_m to Avoid Weak Weld Line (°C) | Optimal Flow Front Speed (cm/s) | Max Speed for Tm = Tg + 20°C |
|---|---|---|---|---|
| PLA | 55-60 | 75 | 15-25 | 20 |
| PMMA | 105 | 130 | 10-20 | 15 |
| PS | 100 | 120 | 20-30 | 25 |
| PP | -20 | 40 | 30-40 | 35 |
Experimental Protocol: Characterizing Weld Line Strength
- Material Preparation: Dry the polymer resin (e.g., PLA) according to manufacturer specifications.
- Mold Instrumentation: Instrument a double-gated tensile bar mold with flush-mounted pressure and temperature sensors at the flow confluence point.
- Parameter Matrix: Conduct a Design of Experiments (DoE) varying mold temperature (Tm) from Tg to T_g+50°C and injection speed (converted to flow front speed).
- Molding & Data Acquisition: Inject material, recording pressure/temperature at the weld line area in real-time.
- Post-Processing & Testing: Condition molded parts for 48 hours. Perform tensile tests on samples, noting failure location (weld line vs. bulk material). Calculate weld line strength ratio (Strengthweld/Strengthbulk).
- Analysis: Correlate strength ratio with recorded T_m and flow front speed at confluence to establish processing window.
Q2: We observe "flow hesitation" where the polymer flow slows or stalls before filling thin-walled sections of our microfluidic chip mold, leading to short shots. How do T_m and flow speed interact to cause this?
A: Flow hesitation occurs due to a rapid imbalance between conductive heat loss to the mold and viscous heating. When the flow front enters a thin section, the surface-to-volume ratio increases, accelerating cooling. If the initial flow front speed is too low and/or Tm is too low, the material viscosity at the front spikes abruptly, causing hesitation or complete freezing. Remediation requires increasing the initial flow front speed to reduce cooling time *before* the thin section, and/or raising Tm to maintain material above its no-flow temperature.
Experimental Protocol: Mapping Flow Hesitation via Short Shot Study
- Mold: Use a mold with a progressive thickness change (e.g., 2mm to 0.5mm).
- Setup: Set a constant, high Tm (e.g., Tg + 40°C).
- Short Shot Sequence: Perform a series of injections at a constant, low injection speed, progressively increasing injection volume by 5% increments.
- Flow Front Capture: Use mold visualization or part ejection to measure the precise flow front position at each volume.
- Analysis: Plot flow front position vs. injected volume. A deviation from linearity indicates the onset of hesitation at the thickness transition. Repeat at different T_m and initial speed settings to map the hesitation boundary.
FAQs
Q3: What are the most effective machine adjustments to remediate an existing weld line defect without changing the mold?
A: The following adjustments, in order of priority, are recommended:
- Increase Mold Temperature: The single most effective change. Raises the temperature at the flow front, promoting better polymer chain diffusion and entanglement at the weld line.
- Increase Injection Speed (to raise flow front speed): Reduces the time for the polymer to cool before fronts meet. Must be balanced against other defects (jetting, flash).
- Increase Holding Pressure and Time: Enhances packing at the weld line area, forcing more material into the confluence zone to improve density.
- Adjust Switchover to Volume Control: Ensure the cavity is 95-99% full before switching to packing pressure to maintain a hot melt stream.
Q4: How can we proactively design experiments to prevent flow hesitation in complex, multi-thickness molds?
A: Implement a strategy based on the Flow Rate Profile (FRP):
- Simulate First: Use Mold Flow analysis software to identify potential hesitation areas.
- Profile the Injection: Program the injection molding machine to use a multi-stage injection profile. Set a high initial speed to rapidly fill up to the thin section, then a sustained, controlled speed through the thin section to avoid high shear stresses.
- Gate Location: If possible in the design phase, gate into the thickest section to allow the flow front to be hot and fast before entering thin areas.
The Scientist's Toolkit: Research Reagent & Material Solutions
Table 2: Essential Materials for Mold Flow & Defect Research
| Item | Function in Experiment |
|---|---|
| Instrumented Mold (with piezoelectric pressure & cavity temperature sensors) | Provides real-time, in-cavity data on pressure and temperature at critical locations (e.g., weld line confluence). |
| Design of Experiments (DoE) Software (e.g., JMP, Minitab) | Structures the parameter variation (T_m, speed, pressure) to efficiently model interactions and identify optimal process windows. |
| High-Speed Imaging System / Mold Visualization | Allows direct observation of flow front behavior, hesitation, and weld line formation. |
| Characterized Polymer Resins (with known rheological data: viscosity vs. shear/temp curves) | Essential for accurate simulation and understanding material-specific responses to T_m and speed changes. |
| Tensile Tester with Environmental Chamber | Quantifies the mechanical strength of weld lines versus bulk material under controlled conditions. |
| In-Mold Rheology Monitoring System | Calculates apparent viscosity in real-time during filling, directly linking process parameters to material behavior. |
Experimental Workflow & Pathway Diagrams
Diagram Title: Weld Line Research Experimental Workflow
Diagram Title: Weld Line Formation Causality Pathway
The Role of Mold Surface Finish (Texture, Polish) in Gloss Uniformity
Troubleshooting Guide: Gloss Uniformity Defects
Issue: Inconsistent Gloss (Matte & Shiny Patches) on Molded Parts
| Symptom | Possible Cause (Mold Surface Related) | Diagnostic Test | Corrective Action |
|---|---|---|---|
| Random glossy streaks in matte finish. | Contamination (silicone, oil, release agent) on tool surface. | Wipe mold surface with acetone on a clean lint-free cloth and inspect. | Perform a thorough mold cleaning protocol. Use approved mold cleaners. |
| Dull patches on a high-gloss part. | Micro-scratches or corrosion on polished cavity. | Use a digital microscope (200x) to inspect the cavity surface. | Re-polish the cavity to the original specification (e.g., SPI A1). |
| Non-repeating gloss variation. | Inadequate or inconsistent mold temperature. | Map cavity surface temperature with a thermal camera during cycle. | Optimize and stabilize mold temperature control per thesis parameters. |
| Gloss difference near gates vs. end of fill. | Flow front speed slowdown causing different surface replication. | Short-shot studies to visualize flow front progression. | Increase injection speed or adjust V/P switchover to maintain uniform front speed. |
Issue: Poor Replication of Mold Texture
| Symptom | Possible Cause (Mold Surface Related) | Diagnostic Test | Corrective Action |
|---|---|---|---|
| Texture appears washed-out or shallow. | Insufficient packing pressure or time. | Measure part weight vs. theoretical full weight. | Increase pack pressure and time to force material into texture valleys. |
| Sharp gloss line at flow leaders. | Excessive shear heating altering surface formation. | Moldflow analysis or empirical test with melt temp drop. | Modify texture design at problem areas, consider a lighter texture (e.g., SPI B) or adjust gate location. |
| Gloss banding perpendicular to flow. | Hesitation or race-tracking effect due to wall thickness variations. | Use cavity pressure sensors to track fill pattern. | Optimize wall thickness uniformity and gate placement to ensure balanced fill. |
Frequently Asked Questions (FAQs)
Q1: Within our research on gloss transition defects, how does mold surface finish rank in importance vs. mold temperature and flow front speed? A1: Mold surface finish is the direct replicating interface. While temperature and flow speed are critical process variables controlling the polymer's ability to replicate that finish, the finish itself is the master template. An imperfect or contaminated finish will yield non-uniform gloss regardless of optimal process conditions.
Q2: We observe different gloss on parts from the same mold. The surface looks clean. What should we check? A2: This points to process variability. First, verify the consistency of mold temperature (check chiller, water lines) and flow front speed (check hydraulic consistency, switchover point). Use Design of Experiments (DoE) holding surface finish constant to isolate the effect of temperature and velocity on gloss for your material.
Q3: What is the best quantitative method to measure mold surface finish for gloss correlation studies? A3: Use a contact profilometer to measure Ra (average roughness) and Rz (maximum height) parameters. For polished surfaces, optical interferometry is preferred. Correlate these measurements with gloss meter readings (e.g., at 60°) from parts produced under tightly controlled temperature and fill speed conditions.
Q4: For a matte finish (e.g., SPI C-1), how does mold temperature specifically affect gloss? A4: Higher mold temperature allows the polymer melt to remain fluid longer, enabling better replication of the texture's peaks and valleys, which typically results in lower gloss (more matte) because it scatters more light. Conversely, a cold mold freezes the skin prematurely, replicating only the peaks and creating a smoother, glossier surface. The exact magnitude requires experimental determination for your polymer.
Q5: Can a "perfect" polish eliminate gloss variations caused by flow lines? A5: No. A high-polish (SPI A1) surface will make flow-induced gloss variations more apparent. Variations in shear, orientation, and cooling at the flow front become highly visible as bands (gate blush, jetting, flow lines) on a mirror surface. Controlling flow front speed and temperature is paramount to minimize these defects on polished surfaces.
Experimental Protocol: Quantifying the Interaction of Surface Finish, Mold Temperature, and Flow Speed
Objective: To isolate and quantify the effect of three distinct mold surface finishes on part gloss under varying mold temperatures and injection speeds.
Materials: See "Research Reagent Solutions" below.
Methodology:
- Tool Preparation: Fabricate a single cavity test mold with three interchangeable inserts (Polished: SPI A1, Textured: SPI B1, Matte: SPI C-1). Verify finish with a profilometer.
- Process Parameter DoE: For each insert, run a full factorial DoE:
- Mold Temperature: Low (Tmelt - 40°C), Medium (Recommended), High (Near HDT).
- Injection Speed: Slow (10% machine capacity), Medium (50%), Fast (90%).
- Hold pressure and time constant to ensure full packing.
- Data Collection:
- Measure part gloss at three fixed locations (near gate, middle, end-of-fill) using a 60° gloss meter (5 readings averaged).
- Record actual cavity surface temperature via embedded sensor.
- Record injection pressure profile to calculate approximate flow front speed.
- Analysis: Perform ANOVA to determine the significance of each factor (finish, temperature, speed) and their interactions on gloss uniformity (standard deviation across part).
Table 1: Main Effects of Process Variables on Gloss (60°) for Different Finishes
| Mold Surface Finish (SPI Standard) | Baseline Gloss (GU) | Effect of High Mold Temp | Effect of High Flow Speed | Most Critical Factor for Uniformity |
|---|---|---|---|---|
| A1 (Mirror Polish) | 95 - 110 GU | Increases Gloss (+5-8 GU) | Reduces Flow Lines, Increases Gloss | Flow Front Speed (controls visibility of flow lines) |
| B1 (Fine Texture) | 20 - 35 GU | Decreases Gloss (-5-10 GU) | Minor Increase in Gloss (+2-4 GU) | Mold Temperature (controls texture replication depth) |
| C-1 (Matte) | 2 - 10 GU | Decreases Gloss (-2-3 GU) | Negligible Effect | Mold Cleanliness & Temperature (prevents contamination gloss spots) |
Key Research Reagent Solutions & Materials
| Item Name | Function/Description | Critical Specification for Research |
|---|---|---|
| Optical Profilometer | Non-contact 3D measurement of mold surface roughness (Sa, Sz). | Vertical resolution < 0.1 nm for polished surfaces. |
| Benchtop Gloss Meter | Measures specular reflectance (gloss) of molded parts. | 60° angle, calibrated to NIST traceable standards. |
| High-Temperature Mold Release (Non-Silicone) | Allows part ejection without contaminating the mold surface. | Chemically inert to polymer; leaves no residue. |
| Precision Mold Polish Kit | For maintaining or refurbishing polished cavity surfaces. | Contains diamond pastes from 5 micron to 0.5 micron. |
| Cavity Pressure & Temperature Sensors | Directly measures in-mold process conditions. | Sampling rate > 1kHz for pressure; response time < 10ms for temp. |
| Polymer Pellets (Test Material) | Primary material under study (e.g., PP, ABS, PC). | Must be of a single, controlled lot to minimize material variation. |
Experimental Workflow Diagram
Title: Experimental Workflow for Gloss Study
Factor Interaction Logic Diagram
Title: Key Factors Influencing Gloss Uniformity
Technical Support Center
Troubleshooting Guides & FAQs
Q1: Our thin-wall polycarbonate housing shows a distinct gloss band coinciding with a flow hesitation line. What is the primary cause?
- A1: This is a classic gloss transition defect. It occurs when the advancing flow front speed drops below a critical threshold, causing a sudden increase in shear stress and molecular orientation at the polymer melt-to-mold interface. This altered surface morphology scatters light differently. The primary cause is an imbalance between injection speed and mold temperature, leading to premature freezing of the skin layer.
Q2: What are the critical quantitative thresholds for flow front speed and mold temperature to avoid gloss bands in amorphous resins like PC?
- A2: Based on current research, maintaining a flow front speed above a critical value is essential. The required mold temperature is material-specific. See the table below for generalized parameters.
Table 1: Critical Process Windows for Gloss Homogeneity in Thin-Wall (≤1mm) Housings
Material Critical Flow Front Speed (m/s) Minimum Mold Temperature (°C) for High Gloss Recommended Melt Temperature (°C) Polycarbonate (PC) >0.45 110 - 120 290 - 310 PC/ABS Blend >0.35 80 - 95 250 - 270 PMMA >0.30 70 - 85 240 - 260 Note: Values are indicative. Actual thresholds depend on part geometry, gate design, and specific grade.
Q3: What is the definitive experimental protocol to isolate the effect of mold temperature on gloss band formation?
- A3: Protocol: Mold Temperature Stepwise Analysis
- Setup: Instrument the mold with flush-mounted cavity pressure and temperature sensors along the flow path. Use a mold with a constant wall thickness (e.g., 0.8mm).
- Stabilization: Set the injection speed to a constant, high value (to initially eliminate speed-induced bands). Set melt temperature to the material mid-range.
- Variable: In a series of consecutive shots, increase the mold coolant temperature in 10°C increments from 40°C up to the material's heat deflection temperature limit.
- Data Collection: For each shot, record the actual mold surface temperature (via sensors), fill time, and the precise location of any visual gloss transition.
- Analysis: Plot gloss transition location vs. local mold temperature at the flow front. This identifies the critical local mold temperature for gloss transition for your specific tool.
- A3: Protocol: Mold Temperature Stepwise Analysis
Q4: How do we design a Design of Experiment (DoE) to model the interaction between flow front speed and mold temperature?
- A4: Use a two-factor, multi-level DoE. The workflow is as follows:
Title: DoE Workflow for Gloss Banding Analysis
- Q5: What signaling pathway describes the chain of events from process parameters to final surface gloss?
- A5: The defect formation follows a causal material-response pathway.
Title: Pathway from Process to Gloss Defect
The Scientist's Toolkit: Research Reagent Solutions
Table 2: Essential Materials & Instrumentation for Gloss Transition Research
| Item | Function/Explanation |
|---|---|
| Instrumented Production Mold | Contains piezoelectric pressure and temperature sensors to capture real-time process data within the cavity. |
| High-Speed Data Acquisition System | Captures sensor data at >5000 Hz to resolve rapid changes during filling. |
| Portable Glossmeter (60° angle) | Quantifies gloss units (GU) at precise locations on the part for objective comparison. |
| Confocal Laser Scanning Microscope | Measures nano-scale surface topography (Sa, Sz) to correlate gloss with physical roughness. |
| Rheological Characterization Software | Generates accurate viscosity models for simulation, critical for predicting shear stress. |
| Decoupled Molding Process Controller | Allows independent, precise control of 1st stage injection speed and 2nd stage packing. |
| Mold Surface Temperature Probe | Validates actual mold surface temperature, which can differ from coolant set points. |
Validating Solutions: Comparative Analysis of Control Strategies and Their Efficacy
Technical Support Center
Troubleshooting Guides & FAQs
Q1: Our gloss measurements on injection-molded plaques show high variability (>2 GU) between replicates. The plaques appear uniform visually. What could be the cause within the context of mold temperature research? A: This is a common issue when studying gloss transition defects. Variability often stems from inconsistent sample conditioning or measurement positioning. Ensure all samples are conditioned at 23±2°C and 50±5% RH for at least 24 hours prior to measurement. Crucially, for mold temperature studies, ensure the measurement spot is consistently at least 25mm from any edge and always targets the same flow path region. High gloss variability can indicate localized flow front speed variations causing micro-surface texture differences. Clean the measurement aperture and reference standard with a lens cloth and isopropyl alcohol before each session.
Q2: When correlating low gloss (matte finish) to high mold temperature, our 60° gloss meter readings are consistently below 10 GU and lack discrimination. Which standard angle should we use? A: For low-gloss surfaces (readings <10 GU at 60°), both ASTM D523 and ISO 2813 mandate the use of an 85° geometry to increase measurement sensitivity. Switch your glossmeter to 85°. Ensure the incident plane is parallel to the suspected flow direction, as gloss can be anisotropic. This is critical for detecting subtle gloss transitions caused by flow front speed and temperature interplay.
Q3: How do we validate that our glossmeter is performing correctly for a longitudinal study on temperature-induced gloss bands? A: Perform a three-point calibration before each measurement session using certified primary standards (typically 0, 100, and an intermediate ~50 GU standard). Document the calibration values. If the instrument fails to read within the manufacturer's tolerance (typically ±1 GU of the standard's value), it may require servicing. For research-grade data, also perform a weekly "master calibration" check against a set of traceable, stable tile standards that mimic your sample's gloss range.
Q4: We observe a gloss gradient along the flow path, but the transition is gradual. How should we map it quantitatively to correlate with our simulated flow front speed data? A: Develop a systematic mapping protocol. Define a measurement grid with points at fixed intervals (e.g., every 10mm) along the primary flow path and perpendicular to it. At each point, take three measurements, rotating the sample ~120° each time to check for anisotropy. Record the average. This generates a 2D gloss contour map that can be directly overlaid with simulated fill patterns and temperature data to identify sharp transition boundaries.
Q5: According to ISO 2813, measurement results must include the measurement geometry. For our research paper, how do we report gloss data when comparing 60° and 85° readings? A: You must report the geometry explicitly. Example: "Gloss (85°) = 25.4 GU" or "G_{85} = 25.4". When presenting data, use separate columns or plot series for each geometry. The 60° geometry is for general-purpose use (most plastics), while 85° is for low-gloss surfaces. Do not directly compare numerical values from different angles; instead, discuss trends (e.g., "The inverse correlation with mold temperature was observed in both 60° and 85° geometries").
Table 1: Key Specifications of ASTM D523 vs. ISO 2813
| Parameter | ASTM D523 - 14(2018) | ISO 2813:2014 | Notes for Gloss Transition Research |
|---|---|---|---|
| Standard Geometries | 20°, 60°, 85° | 20°, 60°, 85° | Identical. 60° is primary for general plastics. |
| Measurement Area (Typical) | Elliptical, ~9x15 mm (60°) | Varies by instrument | Must be consistent; small area may increase noise on textured surfaces. |
| Tolerance on Calibration Standards | ±1.0 GU | ±0.5 GU (for ≤50 GU), ±0.75 GU (for 50-100 GU) | Use highest-grade standards for research. |
| Required Replicates | Not specified | Minimum 3 readings | Perform ≥5 for statistical analysis of defect borders. |
| Reportable Value | Average | Average | Also report Std. Dev. to quantify surface uniformity. |
| Condition Requirements | 23±2°C, 50±5% RH | 23±2°C, 50±5% RH | Critical for polymer samples; affects surface physics. |
Table 2: Gloss Interpretation Guide for Molded Plastics
| Gloss Range (60°) | Typical Appearance | Recommended Angle for Study | Likely Process Correlation |
|---|---|---|---|
| >70 GU | High Gloss | 20° (if >70) or 60° | High mold temp, fast flow front, smooth tool. |
| 10 - 70 GU | Semi-Gloss / General | 60° | Standard process window. Transitions occur here. |
| <10 GU | Low Gloss / Matte | 85° | Low mold temp, slow flow, tool texture replication. |
Experimental Protocols
Protocol 1: Baseline Gloss Characterization of Mold Tool
- Objective: Establish the maximum achievable gloss for a given polymer/tool system.
- Method: a. Set injection molding machine to optimal parameters for full packing and minimal stress (high mold temperature, slow-moderate fill speed). b. Produce a minimum of 10 plaque samples. c. Condition samples per ASTM/ISO standards for 24 hours. d. Calibrate glossmeter with primary standards at the intended geometry (e.g., 60°). e. At the center of each plaque (≥25mm from edges), take 5 gloss measurements in a small circle pattern, rotating the instrument slightly between readings. f. Calculate mean and standard deviation. This value is the Tooling Limit Gloss.
Protocol 2: Systematic Mapping of Gloss Transition Defects
- Objective: Quantify the spatial distribution of gloss relative to gate and fill pattern.
- Method: a. Produce samples using the process parameters suspected to cause gloss bands (e.g., low mold temperature, fast fill). b. Condition samples. c. Place the sample on a registration jig to ensure repeatable positioning under the glossmeter aperture. d. Using a programmed XY stage or a marked grid, measure gloss at predetermined points (e.g., 10mm grid). e. At each point, record 3 measurements. f. Create a contour plot or heat map of gloss values (average GU) versus position. g. Overlay this map with simulated flow front velocity and temperature cooling profiles from molding software.
Protocol 3: Correlating Single-Point Gloss with Process Parameters
- Objective: Develop a quantitative relationship between gloss, mold temperature, and flow front speed.
- Method: a. Design a Design of Experiments (DoE) varying mold temperature (e.g., 40°C, 70°C, 100°C) and injection speed (e.g., slow, medium, fast). b. For each combination, produce 5 replicate samples. c. Measure gloss at a fixed, critical location (e.g., known defect zone) using the appropriate geometry (60° or 85°). d. Perform statistical analysis (e.g., ANOVA) to determine the significance of each factor and their interaction on the gloss reading. e. Generate a response surface model.
Diagrams
Title: Gloss Measurement Experimental Workflow
Title: Process Parameter Effects on Gloss Output
The Scientist's Toolkit: Research Reagent Solutions
Table 3: Essential Materials for Gloss Transition Research
| Item | Function | Critical Specification |
|---|---|---|
| Primary Calibration Standards | Provides traceable calibration for glossmeter. Typically a set of three (low, mid, high gloss). | Certified and traceable to NIST or equivalent national body. Stability over time. |
| Stable Reference Tiles | Daily or weekly check of instrument stability. Used to track instrument drift. | Made of durable, scratch-resistant material (e.g., polished black glass, ceramic). |
| Non-Abrasive Lens Cloths | Cleaning of instrument aperture and calibration standards without scratching. | Lint-free, made of microfiber or similar material. |
| Optical Grade Solvent | Removes oily residues from aperture and standards. | Reagent-grade Isopropyl Alcohol (>99% purity). |
| Conditioning Chamber | Brings samples to standard temperature and humidity before measurement. | Capable of maintaining 23±1°C and 50±5% RH. |
| Sample Registration Jig | Holds sample in precise, repeatable position under glossmeter. | Custom-machined for specific plaque geometry. Minimizes measurement positional error. |
| XYZ Positioning Stage (Optional) | Enables automated, precise mapping of gloss across a sample surface. | Programmable, with ±0.5mm or better repeatability. |
Troubleshooting Guides & FAQs
FAQ: General Principles
Q1: How do mold temperature control strategies directly influence gloss uniformity in polymer parts? A1: Gloss is a surface optical property determined by the replication of the mold's surface finish. Constant temperature (isothermal) molding maintains a steady, often sub-optimal, mold temperature. Variotherm (or thermal cycling) rapidly heats the mold to near or above the polymer's glass transition temperature (Tg) before injection, then cools it rapidly after filling. This reduces the polymer's viscosity during filling, allowing for perfect replication of mold texture, thereby eliminating flow-induced gloss variations and improving uniformity.
Q2: Within the thesis context of controlling gloss transition defects, what is the primary mechanism by which flow front speed interacts with mold temperature? A2: At low mold temperatures, the polymer melt front freezes rapidly upon contact with the mold wall. A slow flow front exacerbates this, creating a high-shear, oriented frozen layer with a different light scattering profile (matte appearance). A fast flow front under variotherm conditions maintains melt fluidity, allowing the polymer chains to relax and replicate the mold surface before solidifying, resulting in high, uniform gloss. The defect—a gloss transition line—occurs where the flow front speed drops below a critical threshold for a given mold temperature.
Troubleshooting: Common Experimental Issues
Q3: Issue: We observe inconsistent gloss measurements across a single part produced using a variotherm process. What could be the cause? A3: Potential Causes & Solutions:
- Insufficient or Non-Uniform Mold Heating: Verify the heating system (inductive, resistive, steam) provides even temperature distribution across the cavity surface. Use thermal imaging during the heating phase to identify cold spots.
- Unstable Cooling Phase: Ensure the cooling channels are designed correctly and the coolant flow rate is sufficient to provide rapid and uniform quenching. Fluctuations in coolant temperature will cause variable solidification rates.
- Sensor Calibration: Recalibrate infrared pyrometers or embedded thermocouples used to control the variotherm cycle.
Q4: Issue: When switching from constant temperature to variotherm, we eliminate gloss defects but see a dramatic increase in cycle time. How can we mitigate this? A4: Optimization Strategy:
- Localized Heating: Implement rapid thermal response (RTR) systems or induction heating that targets only the cavity surface, not the entire mold block, to reduce heating/cooling mass.
- Optimized Cycle Parameters: Use a higher heating temperature for a shorter duration and aggressive but controlled cooling. A DOE (Design of Experiments) should be run to find the minimum heating time needed for gloss uniformity.
- Material Selection: Consider polymers with lower Tg or improved thermal conductivity to reduce the energy and time required for surface heating.
Q5: Issue: Our quantitative gloss data at constant vs. variotherm conditions shows high standard deviation. How do we improve measurement reliability? A5: Protocol Refinement:
- Measurement Geometry: Standardize to a 60° glossmeter geometry (per ASTM D523/ISO 2813) for most plastics. Ensure consistent, clean calibration.
- Surface Mapping: Implement a predefined grid of measurement points (e.g., 5x5 points on a flat plaque) to account for positional variation. Do not take single-point readings.
- Environmental Control: Conduct measurements in a controlled environment, as dust and ambient humidity can affect readings.
Data Presentation
Table 1: Comparison of Gloss Uniformity under Different Molding Conditions
| Condition | Mold Temp Range (°C) | Avg. Gloss (GU @60°) | Gloss Std. Dev. (GU) | Cycle Time (s) | Presence of Gloss Transition Line |
|---|---|---|---|---|---|
| Constant (Low) | 40 ± 2 | 75 | 12.5 | 30 | Yes (Pronounced) |
| Constant (High) | 90 ± 2 | 88 | 8.2 | 45 | Yes (Subtle) |
| Variotherm | 40140 (Surface) | 95 | 1.8 | 65 | No |
| Optimized Variotherm | 40160 (Local) | 94 | 2.1 | 48 | No |
Table 2: Critical Flow Front Speed for Gloss Transition at Various Mold Temperatures (Polycarbonate)
| Mold Surface Temp (°C) | Critical Flow Front Speed (cm/s) | Resulting Surface Aspect |
|---|---|---|
| 40 | 12 | Below: Matte; Above: Semi-Gloss |
| 80 | 8 | Below: Semi-Gloss; Above: High Gloss |
| 120 | 3 | Below: High Gloss; Above: High Gloss |
Experimental Protocols
Protocol A: Baseline Gloss Measurement under Constant Temperature Conditions
- Setup: Secure a high-gloss mold (SPI A1 finish) in an injection molding machine equipped with stable oil tempering units.
- Stabilization: Set the constant mold temperature to the target value (e.g., 40°C, 90°C). Allow the mold to thermally equilibrate for at least 30 minutes.
- Molding: Inject a selected polymer (e.g., Polycarbonate, ABS) using a standard injection speed profile. Maintain constant holding pressure and cooling time.
- Sampling: Collect a minimum of 30 consecutive parts after process stabilization.
- Measurement: Using a calibrated 60° glossmeter, measure gloss at 25 predefined points on each part's surface, following a fixed grid pattern. Record all data.
Protocol B: Variotherm Process Optimization for Gloss Uniformity
- Setup: Use the same mold fitted with a rapid variotherm system (e.g., induction heating).
- Parameter Definition: Set the target peak surface temperature (e.g., 140°C), heating time (from mold close to injection start), and cooling time.
- DOE Execution: Run a factorial Design of Experiments varying Heating Time (3 levels) and Injection Speed (3 levels), keeping peak temperature constant.
- In-Process Monitoring: Use an infrared pyrometer aimed at the cavity to verify the actual peak surface temperature is reached consistently.
- Sampling & Analysis: For each DOE run, collect 10 parts. Measure gloss uniformity as in Protocol A. Correlate data with monitored temperature and injection pressure curves.
Visualizations
Diagram Title: Variotherm Process for Gloss Control
Diagram Title: Gloss Transition Defect Formation Logic
The Scientist's Toolkit: Research Reagent Solutions
Table 3: Essential Materials & Equipment for Gloss Uniformity Research
| Item | Function in Research | Specification Notes |
|---|---|---|
| Injection Molding Machine | Forms test specimens under controlled pressure, temperature, and speed. | Requires precise injection speed profiling and compatibility with variotherm attachments. |
| Variotherm System | Rapidly cycles mold surface temperature. | Inductive or resistive heating with rapid water cooling. Peak surface temp >180°C capability. |
| High-Gloss Mold | Provides the surface to be replicated. | SPI A1 (Mirror) finish on cavity. Instrumented with temperature/pressure sensors. |
| Glossmeter | Quantifies surface gloss in Gloss Units (GU). | 60° geometry, calibrated with black glass standard. Automated XY stage for mapping preferred. |
| Infrared Pyrometer | Non-contact measurement of mold surface temperature during cycling. | Fast response time (<5ms), accurate within ±2°C in target range. |
| Polymer Resin | Material under study. | Use optically clear grades (e.g., Polycarbonate, PMMA) to amplify visual defect observation. Dried per manufacturer specs. |
| Data Acquisition System | Logs process parameters (temp, pressure) synchronized with cycle. | High sampling rate (>100 Hz) for correlating sensor data with part quality. |
Analyzing the Impact of Different Injection Speed Profiles on Surface Quality.
Welcome to the Technical Support Center for research on gloss transition defects in precision molding. This guide provides troubleshooting and methodological support for experiments investigating injection speed profiles within the broader thesis context of mold temperature and flow front speed control.
Troubleshooting Guides & FAQs
Q1: During a speed profile switch (e.g., fast to slow), we observe a visible flow mark or gloss boundary on the part. What is the cause and how can we mitigate it?
A: This is the core gloss transition defect. The sudden change in flow front speed alters the shear stress and cooling rate at the polymer-mold interface, changing the replication of the mold surface texture.
- Mitigation: Implement a more gradual, ramped speed transition instead of a step change. Ensure the mold temperature is stable and uniform; a low or fluctuating temperature exacerbates this defect. Verify that the switchover point is optimized—often it should occur at a consistent volumetric fill percentage, not just pressure or position.
Q2: Our high-speed injection phase results in a glossy surface, but the part shows jetting or flow instability. How do we maintain gloss without these defects?
A: Jetting occurs when the initial high-speed melt stream fails to adhere to the mold wall and folds onto itself.
- Solution: Modify the initial stage of the speed profile. Use a moderate initial speed to allow the melt to properly contact and "stick" to the mold surface (e.g., the gate area) before ramping up to the high speed required for gloss. Optimizing gate design (e.g., fan gate) is also critical.
Q3: Even with a controlled speed profile, we get inconsistent gloss between batches. What are the key variables to check?
A: Inconsistency points to uncontrolled parameters overshadowing your profile.
- Checklist:
- Mold Temperature: Verify stability and uniformity across the cavity surface using thermal imaging. Even a ±5°C variation can change gloss.
- Material Drying: Moisture in hygroscopic polymers (e.g., many engineering thermoplastics) causes splay and matte surfaces.
- Viscosity Variation: Monitor lot-to-lot differences in polymer melt flow index (MFI). A higher MFI may require profile adjustment.
- Machine Performance: Check for hydraulic or electric servo drift that could alter the actual versus setpoint injection speed.
Experimental Protocols
Protocol 1: Characterizing Gloss Transition vs. Speed Switchover Point Objective: To map the relationship between injection speed profile switchover position and the location/severity of the gloss transition line. Methodology:
- Setup: Instrument a simple rectangular plaque mold with cavity pressure sensors along the flow path.
- Fixed Parameters: Set and stabilize mold temperature (e.g., 80°C, 120°C). Use a constant slow injection speed (e.g., 20 mm/s).
- Variable: For each run, set a high injection speed (e.g., 80 mm/s) but vary the switchover point to the slow speed at 40%, 60%, and 80% of fill volume (calculated via shot size or confirmed by pressure sensor).
- Analysis: Measure gloss (at 60° angle) across the part length. Correlate the gloss transition point with the calculated flow front position at the moment of speed switchover.
Protocol 2: Optimizing a Multi-Stage Ramped Profile Objective: To develop a 4-stage speed profile that eliminates sharp gloss transitions. Methodology:
- Baseline: Run a 2-stage (fast-slow) profile and identify gloss defect location.
- Design: Implement a 4-stage profile: Stage1: Moderate speed to fill gate region. Stage2: High speed for glossy fill. Stage3: Gradual ramp-down over 20-30% of fill volume. Stage4: Slow speed for pack-out.
- Data Acquisition: Record in-machine data: actual screw position vs. speed, hydraulic pressure, and cavity pressure.
- Validation: Compare surface gloss uniformity via gloss mapping and quantify using the standard deviation of gloss measurements across the part surface.
Table 1: Impact of Speed Profile on Surface Gloss (Mold Temp: 90°C, Material: Polycarbonate)
| Injection Speed Profile | Avg. Gloss (GU @60°) Near Gate | Avg. Gloss (GU @60°) End of Fill | Gloss Uniformity (Std. Dev.) | Observed Defects |
|---|---|---|---|---|
| Single-Stage (Slow, 25 mm/s) | 85 | 72 | 6.5 | Matte finish, no visible line |
| Single-Stage (Fast, 100 mm/s) | 95 | 94 | 0.8 | High gloss, potential jetting |
| 2-Stage: Fast (80 mm/s) to Slow (25 mm/s) @ 70% fill | 94 | 75 | 9.2 | Sharp gloss transition line |
| 4-Stage: Ramped Deceleration | 92 | 88 | 2.1 | No visible line, uniform appearance |
Table 2: Interaction Effect: Mold Temperature & Speed Switchover
| Mold Temp (°C) | Speed Switchover (Fill %) | Gloss Differential (ΔGU) | Defect Severity (1-5 Scale) |
|---|---|---|---|
| 70 | 60% | 24 | 5 (Very Severe) |
| 70 | 85% | 19 | 4 |
| 110 | 60% | 9 | 2 (Moderate) |
| 110 | 85% | 5 | 1 (Mild) |
Visualization: Experimental Workflow & Cause-Effect
The Scientist's Toolkit: Research Reagent Solutions
| Item | Function in Research |
|---|---|
| High-Precision Injection Molding Machine | Allows precise, repeatable control of multi-stage injection speed profiles (mm/s) and switchover by position, pressure, or volume. |
| Modular Test Mold (Plaque Geometry) | Instrumented with piezoelectric pressure/temperature sensors to directly link process parameters to in-cavity conditions. |
| Gloss Meter (60° Geometry) | Quantifies surface gloss in Gloss Units (GU) for objective comparison of different speed profiles. |
| Atomic Force Microscope (AFM) | Analyzes nanoscale surface topography and replication fidelity of the mold texture, explaining gloss differences. |
| Thermocouples / Thermal Imaging Camera | Monitors mold surface temperature stability and uniformity, a critical interacting variable. |
| Standardized Polymer Resin (e.g., PS, PC, PMMA) | Controlled rheology (known MFI) to isolate the effect of speed from material variation. |
| Mold Surface Replicating Film | Allows for non-destructive analysis of surface finish on curved or complex parts. |
Troubleshooting Guides & FAQs
Q1: During injection molding of PP parts, we observe inconsistent gloss between batches despite constant mold temperature settings. What is the primary cause? A1: The primary cause is likely the semi-crystalline nature of PP. Gloss is highly dependent on the degree of crystallization, which is controlled by cooling rate. Even with a constant mold temperature, variations in flow front speed can change the shear-induced crystallization and the alignment of polymer chains at the surface. A slower flow front allows more time for crystallization at the mold wall, leading to a rougher, lower-gloss surface. Ensure precise control of injection speed and hold pressure between batches.
Q2: Our ABS components show glossy streaks in matte-finish areas. How is this related to mold temperature or flow? A2: This is a classic "gloss transition" defect. In ABS, surface finish is determined by the replication of the mold surface texture. Glossy streaks occur where the polymer melt contacts and fully replicates the smooth mold surface, while matte areas result from micro-scale shrinkage away from textured surfaces. The defect is caused by localized variations in cooling and packing. High flow front speed can generate excessive shear heat, momentarily raising the local mold interface temperature and preventing effective texture replication. Increasing the overall mold temperature can sometimes homogenize the effect but may compromise the matte finish.
Q3: When molding PC, we achieve high gloss but with visible flow lines (jetting). How do processing parameters interact to cause this? A3: Polycarbonate (PC) is amorphous and typically yields high-gloss surfaces. Jetting occurs when the melt stream shoots into the mold cavity without forming a stable flow front. This turbulent flow cools and sets unevenly, creating visible lines. While directly a flow front issue, it interacts with gloss control. The primary cause is too high an injection speed coupled with a gate design that doesn't impede the flow. Reducing the injection speed to ensure a laminar flow front and increasing the mold temperature to delay premature freezing are critical. This ensures the polymer flows in a stable front, allowing for uniform surface formation.
Q4: For high-performance PEEK, we struggle with achieving any level of consistent gloss. What makes it uniquely challenging? A4: PEEK's challenge stems from its very high melting point (~343°C) and high crystallization rate. The large temperature differential between the melt and the mold (even when the mold is heated >160°C) causes rapid quenching at the surface. This leads to a complex morphology gradient through the part thickness. Slight variations in mold temperature (even ±5°C) significantly alter the surface crystallization kinetics, causing gloss variations. Furthermore, PEEK is highly sensitive to shear; inconsistent flow front speed can cause localized degradation or varied crystallinity, manifesting as gloss bands.
Table 1: Key Material Properties & Gloss Sensitivity
| Material | Type | Key Gloss-Defining Property | Critical Mold Temp Range (°C) | Sensitivity to Flow Front Speed |
|---|---|---|---|---|
| PP | Semi-Crystalline | Crystallinity & Spherulite size at surface | 40 - 80 | High: Speed alters shear crystallization. |
| ABS | Amorphous | Replication of mold surface texture | 50 - 80 | Very High: Speed affects shear heating & packing. |
| PC | Amorphous | Molecular orientation at surface | 80 - 120 | Medium: Speed must be optimized to avoid jetting. |
| PEEK | Semi-Crystalline | Degree of crystallinity at skin layer | 160 - 200 | Extreme: Speed and temp must be tightly coupled. |
Table 2: Common Gloss Defects and Primary Control Parameter
| Defect Phenotype | Most Susceptible Material | Primary Controlling Parameter | Corrective Action Focus |
|---|---|---|---|
| Matte/Gloss Streaks | ABS, PP | Flow Front Speed | Increase mold temp; Optimize injection speed profile. |
| Cloudy Haze | PP, PEEK | Mold Temperature | Increase mold temp to allow uniform crystallization. |
| Flow Lines / Jetting | PC, ABS | Flow Front Speed | Reduce injection speed; Modify gate design. |
| Gloss Banding (Zebra Stripes) | PEEK, PP | Mold Temperature & Flow Front Speed | Ensure extreme stability of both parameters. |
Experimental Protocols
Protocol 1: Mapping Gloss Transition vs. Mold Temperature & Flow Front Speed Objective: To empirically establish the process window for consistent gloss for each material.
- Design: Create a full-factorial Design of Experiment (DOE) with Mold Temperature (3-5 levels) and Injection Speed/Flow Front Speed (3-5 levels) as factors.
- Sample Production: Use a standard plaque mold (e.g., 100mm x 100mm x 2mm). Process each material according to its DOE matrix, logging all parameters.
- Measurement: Condition samples at 23°C/50% RH for 24 hours. Measure gloss at 60° angle using a calibrated glossmeter at 5 fixed points on each plaque.
- Analysis: Calculate the average and standard deviation of gloss readings for each processing condition. Plot 3D response surfaces (Gloss vs. Temp vs. Speed) to identify stable process windows.
Protocol 2: Characterizing Surface Morphology via Atomic Force Microscopy (AFM) Objective: To correlate gloss measurements with physical surface topography.
- Sample Selection: Select samples from Protocol 1 representing high, low, and inconsistent gloss.
- Preparation: Cut a small section (~10mm x 10mm) from the sample. Clean with isopropyl alcohol in a laminar flow hood to remove contaminants.
- Imaging: Use AFM in tapping mode. Scan multiple 50µm x 50µm and 10µm x 10µm areas to obtain surface roughness (Ra, Rz) data and 3D topography maps.
- Correlation: Statistically correlate Ra/Rz values with glossmeter readings to establish a quantitative relationship between roughness and perceived gloss for each material.
Visualization
Diagram 1: Research Workflow for Gloss Defect Analysis (68 chars)
Diagram 2: Interaction of Parameters Causing Gloss Transition (75 chars)
The Scientist's Toolkit: Research Reagent Solutions
| Item | Function in Gloss Control Research |
|---|---|
| High-Precision Glossmeter (60°) | Quantifies surface reflectance to provide a standardized gloss value (GU) for objective comparison. |
| Laboratory Injection Molding Machine | Allows precise, repeatable control of melt temperature, injection speed/pressure, and mold temperature for DOE execution. |
| Atomic Force Microscope (AFM) | Measures nanoscale surface topography and roughness (Ra), directly linking physical structure to optical gloss. |
| Differential Scanning Calorimeter (DSC) | Analyzes the thermal history and degree of crystallinity in semi-crystalline polymers (PP, PEEK), key to understanding surface morphology. |
| Modulated Temperature DSC | Specifically useful for separating complex crystallization events in high-performance polymers like PEEK. |
| Standardized Texture Mold (SPI) | A mold with defined matte/textured and glossy areas, essential for studying replication-based gloss phenomena in ABS and PC. |
| Mold Temperature Controllers | Critical for maintaining the mold surface temperature within a narrow range (±1°C), especially for PEEK and PC. |
| In-Cavity Pressure & Temperature Sensors | Provides real-time data on flow front progression and cooling behavior, linking process dynamics to final part properties. |
Validating Process Windows Through Design of Experiments (DoE) and Statistical Analysis
Technical Support Center: Troubleshooting & FAQs
Q1: During my DoE for mold temperature optimization, my response data for gloss measurement shows high variability within replicate runs. What could be the cause? A: This is often due to inadequate process stabilization or measurement inconsistency. First, ensure the molding machine reaches a thermal steady-state; run at least 10-15 purges before data collection. Second, verify the calibration and positioning of your glossmeter. Use a fixed jig to measure the same spot on each part. Third, check for environmental factors like ambient humidity fluctuations, which can affect cooling rates. Implement a randomized run order to help identify noise factors.
Q2: My regression model from the DoE shows a low R-squared value (<0.7) for predicting gloss levels. How can I improve model fit? A: A low R-squared suggests missing factors or interactions. 1) Review your factor ranges; you may be operating in a region of high nonlinearity. Consider adding center points or moving to a Response Surface Methodology (RSM) design. 2) Include suspected interactions (e.g., mold temperature * injection speed) in a new design. 3) Check for outliers using studentized residual plots; a single aberrant data point can severely impact the model. 4) Confirm you are measuring the correct response; consider if gloss is the primary indicator or if a combined metric (e.g., gloss uniformity) is better.
Q3: When analyzing ANOVA results, how do I distinguish between a significant factor and a statistically significant but practically irrelevant one? A: Statistical significance (p-value < 0.05) must be paired with an assessment of practical significance. Examine the effect size (coefficient estimate). For example, a 5°C change in mold temperature resulting in a 0.1 gloss unit change may be statistically significant but not meaningful for your quality specification. Use the confidence intervals of the coefficient—if the range of possible effect sizes includes values that would not impact the final product, the factor may be practically irrelevant. Always overlay statistical findings with physical process knowledge.
Q4: The contour plots from my RSM design suggest an optimal process window, but verification runs fail. What steps should I take? A: This indicates the model may not be predictive, often due to a poor model or unstable process. 1) Conduct a model adequacy check: run Lack-of-Fit F-test, examine residual plots for patterns. 2) Check for factor boundaries; the optimum may lie at the edge of your explored region, making it sensitive to minor drift. Expand the design space. 3) Confirm that all critical noise factors (e.g., material batch variance, tool wear) were accounted for. Use a robust parameter design (Taguchi methods) in your next DoE to find settings less sensitive to noise.
Q5: I am unsure how to choose between a Full Factorial, Fractional Factorial, or Plackett-Burman design for initial screening of factors affecting flow front speed and gloss. A: The choice depends on the number of factors and resources.
- Full Factorial (2^k): Use for 4 or fewer factors. It estimates all main effects and interactions without confounding but becomes resource-intensive with more factors.
- Fractional Factorial (2^(k-p)): Ideal for screening 5-8 factors. It sacrifices higher-order interactions (assumed negligible) for efficiency. Resolution IV or V designs are preferred to avoid confounding main effects with two-factor interactions.
- Plackett-Burman: Useful for very rough screening of many factors (e.g., >8) with very few runs, but it only estimates main effects and confounds them heavily with two-factor interactions. Best followed by a more detailed design.
Table 1: Example DoE Design Matrix and Results for Gloss Transition Study
| Run Order | Mold Temp (°C) | Inj. Speed (mm/s) | Pack Pressure (MPa) | Cool Time (s) | Avg. Gloss (GU) | Flow Front Speed (m/s) |
|---|---|---|---|---|---|---|
| 1 | 60 | 50 | 60 | 20 | 78.2 | 0.32 |
| 2 | 100 | 50 | 80 | 30 | 92.5 | 0.41 |
| 3 | 60 | 100 | 80 | 20 | 75.8 | 0.68 |
| 4 | 100 | 100 | 60 | 30 | 94.1 | 0.72 |
| 5 (C) | 80 | 75 | 70 | 25 | 86.4 | 0.52 |
| 6 (C) | 80 | 75 | 70 | 25 | 85.9 | 0.51 |
Table 2: ANOVA Table for Gloss Response Model (Example)
| Source | Sum of Sq. | df | Mean Square | F-value | p-value |
|---|---|---|---|---|---|
| Model | 450.6 | 4 | 112.65 | 45.12 | 0.0012 |
| - Mold Temp (A) | 320.1 | 1 | 320.10 | 128.21 | <0.0001 |
| - Inj. Speed (B) | 5.2 | 1 | 5.20 | 2.08 | 0.2105 |
| - AB Interaction | 105.3 | 1 | 105.30 | 42.18 | 0.0015 |
| - Curvature | 20.0 | 1 | 20.00 | 8.01 | 0.0370 |
| Residual | 17.5 | 7 | 2.50 | ||
| Lack of Fit | 15.0 | 3 | 5.00 | 5.00 | 0.0914 |
| Pure Error | 2.5 | 4 | 0.63 |
Experimental Protocols
Protocol 1: Two-Stage DoE for Gloss Transition Mitigation
- Objective: Identify and optimize critical process parameters (CPPs) for consistent high-gloss surface finish.
- Screening Phase:
- Design: A Resolution V 2^(5-1) Fractional Factorial Design (16 runs + 4 center points).
- Factors: Mold Temperature (60-100°C), Injection Speed (50-100 mm/s), Pack Pressure (60-80 MPa), Cool Time (20-30 s), Material Drying Time (2-4 hrs).
- Response: Gloss (at 60°) measured at 3 locations on the part, Flow Front Speed (via in-cavity sensor).
- Procedure: Randomize run order. After each parameter change, allow 5 cycles for stabilization before collecting 5 consecutive parts for measurement.
- Optimization Phase:
- Design: Central Composite Design (CCD) for the 2-3 significant factors identified in screening.
- Procedure: Execute axial and center points. Use regression analysis to generate a predictive model and contour plots. Define the design space where gloss > 90 GU and flow front speed is 0.5-0.7 m/s.
Protocol 2: In-Mold Cavity Pressure & Temperature Data Acquisition
- Objective: Correlate flow front speed with real-time process data.
- Setup: Install piezoelectric pressure sensors and fast-response thermocouples in the mold cavity, near the gate and end-of-fill.
- Calibration: Calibrate sensors according to manufacturer specs. Synchronize sensor data acquisition with the injection molding machine timer (t=0 at screw forward movement).
- Execution: For each DoE run, record cavity pressure and temperature traces. Calculate flow front speed as the distance between sensors divided by the time difference of the pressure rise at each sensor.
- Analysis: Overlay traces from different runs. Identify the point of viscosity increase (sharp pressure rise) relative to fill time and temperature drop.
Visualizations
Title: DoE Workflow for Process Window Validation
Title: Cause & Effect Pathway for Gloss Defects
The Scientist's Toolkit: Research Reagent Solutions
Table 3: Essential Materials for Mold Temperature/Flow Speed Experiments
| Item | Function/Benefit |
|---|---|
| In-Mold Cavity Pressure Sensors (Piezoelectric) | Provides real-time, high-frequency data on pressure traces during filling and packing, essential for calculating actual flow front speed and identifying viscous heating effects. |
| Fast-Response Mold Thermocouples | Measures actual cavity surface temperature dynamics, crucial for validating mold temperature setpoints and understanding local cooling rates affecting surface finish. |
| Bench-Top Glossmeter (60° geometry) | Quantifies surface gloss as the primary quality response. A 60° angle is standard for medium-gloss surfaces typical of injection molded parts. |
| Rheology Characterization Kit | Used for offline material analysis to determine viscosity curves as a function of shear rate and temperature, informing the selection of injection speed ranges in the DoE. |
| Design of Experiments (DoE) Software | (e.g., JMP, Minitab, Design-Expert) Enables efficient design creation, randomization, statistical analysis (ANOVA, regression), and generation of predictive models and contour plots. |
| Process-Stable Injection Molding Material | A well-characterized polymer (e.g., Polycarbonate or ABS) with consistent lot-to-lot rheological properties to minimize unexplained variation (noise) in the DoE. |
| Mold Surface Replication Standards | Specimens with known gloss values or surface textures used for calibrating measurement systems and verifying process capability for surface replication. |
Technical Support Center: Mold Temperature & Flow Front Speed Control
FAQs & Troubleshooting Guides
Q1: In our high-gloss polymer molding experiments, we observe inconsistent gloss despite a stable mold temperature setpoint. What could be the issue? A: This is a classic symptom of insufficient flow front speed control. A stable mold wall temperature does not guarantee a consistent thermal boundary layer if injection velocity varies. The flow front speed directly governs shear heating and polymer chain orientation at the cavity surface. Use the following protocol to diagnose:
- Protocol 1.1: Instrument your mold with two additional flush-mounted temperature sensors 10mm and 30mm from the gate along the flow path. Monitor real-time temperature differential (ΔT).
- Protocol 1.2: Implement a closed-loop injection velocity profile targeting a constant flow front speed (e.g., 250 mm/s ± 5%). Correlate velocity stability with the ΔT from Protocol 1.1 and gloss measurements (60° gloss meter).
- Likely Cause: PID tuning on the injection servo is too sluggish. Solution: Increase the proportional gain (Kp) for the velocity loop in small increments (e.g., +10%) and retest using Protocol 1.2.
Q2: Our dual-zone mold temperature control unit consumes excessive energy. How can we optimize it without inducing gloss transition defects? A: Energy overconsumption often stems from overcooling or aggressive, non-adaptive PID constants. The key is to implement a model-predictive control (MPC) strategy that pre-heats only the surface layer.
- Protocol 2.1: Perform a Design of Experiment (DoE) to establish the minimum required coolant temperature and flow rate.
- Factor A: Coolant Temperature (40°C, 50°C, 60°C)
- Factor B: Coolant Flow Rate (5 L/min, 10 L/min)
- Response: Part Surface Gloss (GU), Cycle Time (s), Energy Consumption (kWh).
- Protocol 2.2: Based on DoE results, program a dynamic cooling profile: initiate high flow rate at peak viscosity point, then reduce flow during packing. This can cut energy use by 15-25% while maintaining gloss uniformity, as shown in the table below.
Q3: How do we quantify the cost-benefit trade-off when upgrading from PID to a Model Predictive Control (MPC) strategy for our gloss-critical components? A: The analysis must compare capital/development cost against yield and energy savings. Use the following framework to build your business case.
Data Presentation: Quantitative Comparison of Control Strategies
Table 1: Experimental Results from Gloss Control DoE (Hypothetical Data)
| Control Strategy | Avg. Gloss (GU) | Gloss Std. Dev. | Defect Rate (%) | Avg. Cycle Energy (kWh) |
|---|---|---|---|---|
| PID (Fixed Params) | 89 | 4.5 | 7.2 | 1.8 |
| PID (Adaptive Gain) | 91 | 2.1 | 3.1 | 1.7 |
| MPC (Predictive) | 95 | 0.8 | 0.5 | 1.5 |
Table 2: Cost-Benefit Analysis Over 1 Year (10,000 cycles/year)
| Cost/Benefit Factor | PID (Adaptive) | MPC Strategy | Net Change with MPC |
|---|---|---|---|
| Implementation Cost | $5,000 | $25,000 | +$20,000 |
| Energy Cost (@ $0.12/kWh) | $2,040 | $1,800 | -$240 |
| Scrap/Rework Cost (@ $50/part) | $15,500 | $2,500 | -$13,000 |
| Total Annual Cost | $22,540 | $29,300 | +$6,760 |
| Annual Yield Gain | 96.9% | 99.5% | +2.6% (260 parts) |
Experimental Protocols
Protocol: Characterizing Gloss Transition Point via Mold Temperature Gradient.
- Objective: Map the precise mold temperature (Tm) and flow front speed (Vf) at which gloss transitions from high to low.
- Materials: See "Scientist's Toolkit" below.
- Method: a. Set the mold temperature control unit to create a known gradient (e.g., 60°C at gate, 85°C at end-of-fill). b. For five consecutive shots, set injection velocity to achieve a constant Vf of 200 mm/s. c. Measure gloss at 10mm intervals along the flow path for each part. d. Repeat steps b-c for Vf settings of 150 mm/s, 250 mm/s, and 300 mm/s. e. Plot 3D surface: Gloss = f(Tm, Vf). The steepest gradient region is your process window boundary.
Protocol: Validating Energy Savings of a Dynamic Cooling Profile.
- Objective: Reduce cooling phase energy without affecting gloss.
- Method: a. Establish baseline: Run 10 cycles with standard cooling (full flow, constant temperature). Record total energy per cycle via power meter and average gloss. b. Program the TCU to reduce coolant pump speed to 40% after the cavity is 95% packed (use hydraulic pressure or screw position as trigger). c. Run 10 cycles with the dynamic profile. Record energy and gloss. d. Perform a paired t-test on gloss data to confirm no statistical difference (p > 0.05). Calculate percentage energy reduction.
Mandatory Visualization
Diagram Title: Closed-Loop Control Workflow for Gloss Prevention
Diagram Title: Decision Logic for Control Strategy Cost-Benefit
The Scientist's Toolkit: Research Reagent Solutions
| Item | Function in Gloss Transition Research |
|---|---|
| High-Thermal-Conductivity Tool Steel (e.g., AMPCO 940) | Used for mold inserts to achieve fast, uniform temperature response, critical for validating dynamic temperature control algorithms. |
| Flush-Mounted Piezoelectric Pressure/Temperature Sensors | Provide real-time, in-cavity data for closed-loop control of packing pressure and validation of flow front speed models. |
| Non-Contact Infrared Pyrometer | Measures actual part surface temperature upon ejection, correlating cooling rate with final surface gloss. |
| Digital Injection Molding Machine with Open API | Allows researchers to program and extract data for custom velocity and pressure profiles essential for DoE. |
| Precision Mold Temperature Control Unit (TCU) | Enables precise control of coolant temperature (±0.5°C) and flow rate, a key variable in gloss/energy experiments. |
| 60° Gloss Meter (ASTM D523) | Standardized instrument for quantifying surface gloss, the primary response variable in defect research. |
| Shear-Sensitive Polymer Masterbatch | Added to resin to visually indicate flow front patterns and shear history on molded parts. |
Conclusion
Effective control of gloss transition defects necessitates a holistic understanding of the interdependent relationship between mold temperature and flow front speed. Foundational principles confirm that surface morphology is a direct result of the polymer's thermal and shear history at the mold interface. Methodological advances in dynamic temperature control and precision injection profiling provide the tools for direct intervention. A systematic troubleshooting approach, rooted in cause-and-effect analysis, is essential for efficient problem-solving, while quantitative validation through comparative studies ensures robust, economically viable solutions. For biomedical research and drug development, these principles are paramount for manufacturing consistent, high-quality components—from diagnostic device housings to drug delivery parts—where surface integrity can influence function, sterility, and user perception. Future directions include the integration of real-time AI-driven process adaptation and the development of novel polymer formulations designed for wider processing windows, pushing the frontier of precision in polymer processing.